Playing Around with an Elasticsearch/Logstash/Kibana (ELK) Stack
So I decided to try out ELK since I kept hearing so much about it. Currently I use splunk at home and I like, I am not planning on switching over but I did want to see how it compares.
Install Elasticsearch
Some of the components depend on Java so first let’s install that. On my CentOS 7 box I ran the following to install Java 8:
$ sudo yum install java-1.8.0-openjdk-headless
After that we can follow the instructions laid out in the Repositories section of the documentation. First let’s import the GPG key for the RPM packages:
$ sudo rpm --import https://packages.elastic.co/GPG-KEY-elasticsearch
Next let’s create a yum repository:
$ cat /etc/yum.repos.d/es.repo
[elasticsearch-2.x]
name=Elasticsearch repository for 2.x packages
baseurl=http://packages.elastic.co/elasticsearch/2.x/centos
gpgcheck=1
gpgkey=http://packages.elastic.co/GPG-KEY-elasticsearch
enabled=1
And finally let’s install the software:
$ sudo yum install elasticsearch
Test out Elasticsearch
Let’s go ahead and enable and start the service
$ sudo /bin/systemctl daemon-reload
$ sudo /bin/systemctl enable elasticsearch.service
$ sudo /bin/systemctl start elasticsearch.service
To make sure elasticsearch is running we can do an HTTP GET against the service:
┌─[elatov@puppet] - [/home/elatov] - [2015-12-27 02:29:04]
└─[0] <> curl -X GET http://localhost:9200
{
  "name" : "Living Monolith",
  "cluster_name" : "elasticsearch",
  "version" : {
    "number" : "2.1.1",
    "build_hash" : "40e2c53a6b6c2972b3d13846e450e66f4375bd71",
    "build_timestamp" : "2015-12-15T13:05:55Z",
    "build_snapshot" : false,
    "lucene_version" : "5.3.1"
  },
  "tagline" : "You Know, for Search"
}
Install logstash
The install for logstash is similar to elasticsearch and instructions are laid out in the Package Repositories section of the logstash documentation. So let’s create a yum repository:
$ cat /etc/yum.repos.d/ls.repo
[logstash-2.1]
name=Logstash repository for 2.1.x packages
baseurl=http://packages.elastic.co/logstash/2.1/centos
gpgcheck=1
gpgkey=http://packages.elastic.co/GPG-KEY-elasticsearch
enabled=1
Now let’s install logstash:
$ sudo yum install logstash
Test logstash
Let’s create an example of where logstash parses syslog info. There are a bunch of examples at the Logstash Configuration Examples page. I ended up with this:
$ cat /etc/logstash/conf.d/logstash-syslog.conf
input {
  tcp {
    port => 5000
    type => syslog
  }
  udp {
    port => 5000
    type => syslog
  }
}

filter {
  if [type] == "syslog" {
    grok {
      match => { "message" => "%{SYSLOGTIMESTAMP:syslog_timestamp} %{SYSLOGHOST:syslog_hostname} %{DATA:syslog_program}(?:\[%{POSINT:syslog_pid}\])?: %{GREEDYDATA:syslog_message}" }
      add_field => [ "received_at", "%{@timestamp}" ]
      add_field => [ "received_from", "%{host}" ]
    }
    syslog_pri { }
    date {
      match => [ "syslog_timestamp", "MMM  d HH:mm:ss", "MMM dd HH:mm:ss" ]
    }
  }
}

output {
  elasticsearch { hosts => ["localhost:9200"] }
  stdout { codec => rubydebug }
}
To confirm it’s working, launch the logstash daemon manually:
┌─[elatov@puppet] - [/home/elatov] - [2015-12-27 02:46:05]
└─[0] <> /opt/logstash/bin/logstash -f /etc/logstash/conf.d/logstash-syslog.conf
Settings: Default filter workers: 1
Logstash startup completed
Then (from another shell) telnet into port 5000 and paste some sample logs:
┌─[elatov@puppet] - [/home/elatov] - [2015-12-27 02:47:23]
└─[0] <> telnet localhost 5000
Trying 127.0.0.1...
Connected to localhost.
Escape character is '^]'.
Dec 23 12:11:43 louis postfix/smtpd[31499]: connect from unknown[95.75.93.154]
Then on the original shell where logstash was started you will see
{
                 "message" => "Dec 23 12:11:43 louis postfix/smtpd[31499]: connect from unknown[95.75.93.154]\r",
                "@version" => "1",
              "@timestamp" => "2015-12-23T19:11:43.000Z",
                    "host" => "127.0.0.1",
                    "port" => 38565,
                    "type" => "syslog",
        "syslog_timestamp" => "Dec 23 12:11:43",
         "syslog_hostname" => "louis",
          "syslog_program" => "postfix/smtpd",
              "syslog_pid" => "31499",
          "syslog_message" => "connect from unknown[95.75.93.154]\r",
             "received_at" => "2015-12-27T21:47:43.946Z",
           "received_from" => "127.0.0.1",
    "syslog_severity_code" => 5,
    "syslog_facility_code" => 1,
         "syslog_facility" => "user-level",
         "syslog_severity" => "notice"
}
After we confirmed it’s working, ctrl-c from the original logstash daemon and then the start the service using systemd:
$ sudo systemctl enable logstash
$ sudo systemctl start logstash
We will see the following logs created from the daemon:
┌─[elatov@puppet] - [/home/elatov] - [2015-12-27 03:34:51]
└─[0] <> ls -l /var/log/logstash
total 220
-rw-r--r-- 1 root     root          0 Dec 27 14:50 logstash.err
-rw-r--r-- 1 logstash logstash      0 Dec 27 14:50 logstash.log
-rw-r--r-- 1 root     root     223985 Dec 27 15:34 logstash.stdout
We can check out the logstash.stdout file to see live processing of logs.
Install kibana
Most of the instructions are laid out in Installation Steps from the kibana page. First get the binary package:
$ wget https://download.elastic.co/kibana/kibana/kibana-4.3.1-linux-x64.tar.gz
Then let’s install it:
┌─[elatov@puppet] - [/home/elatov] - [2015-12-27 02:55:40]
└─[1] <> tar xzf kibana-4.3.1-linux-x64.tar.gz
┌─[elatov@puppet] - [/home/elatov] - [2015-12-27 02:55:57]
└─[0] <> sudo mv kibana-4.3.1-linux-x64 /opt/kibana
Next let’s add a kibana user
┌─[elatov@puppet] - [/home/elatov] - [2015-12-27 03:05:33]
└─[0] <> sudo groupadd -g 1005 kibana
┌─[elatov@puppet] - [/home/elatov] - [2015-12-27 03:13:49]
└─[0] <> sudo useradd -u 1005 -g 1005 kibana
Let’s change ownership of the installation to our kibana user:
┌─[elatov@puppet] - [/home/elatov] - [2015-12-27 03:13:54]
└─[0] <> sudo chown -R kibana: /opt/kibana
Let’s enable kibana to listen on the network:
$ grep server.host /opt/kibana/config/kibana.yml
server.host: "0.0.0.0"
And let’s create a service file:
┌─[elatov@puppet] - [/home/elatov] - [2015-12-27 03:16:47]
└─[0] <> cat /etc/systemd/system/kibana.service
[Unit]
Description=Kibana 4 Web Interface
After=elasticsearch.service
After=logstash.service
[Service]
ExecStart=/opt/kibana/bin/kibana
Restart=always
StandardOutput=syslog
StandardError=syslog
SyslogIdentifier=kibana4
User=kibana
Group=kibana
Environment=NODE_ENV=production

[Install]
WantedBy=multi-user.target
And now we can just start the service
$ sudo systemctl enable kibana
$ sudo systemctl start kibana
We can check out the journalctl command to make sure it’s running
┌─[elatov@puppet] - [/home/elatov] - [2015-12-27 03:40:40]
└─[130] <> sudo journalctl -u kibana -fl
Dec 27 15:39:59 puppet.dnsd.me systemd[1]: Starting Kibana 4 Web Interface...
Dec 27 15:40:02 puppet.dnsd.me kibana4[7121]: {"type":"log","@timestamp":"2015-12-27T22:40:02+00:00","tags":["status","plugin:kibana","info"],"pid":7121,"name":"plugin:kibana","state":"green","message":"Status changed from uninitialized to green - Ready","prevState":"uninitialized","prevMsg":"uninitialized"}
...
...
Dec 27 15:40:02 puppet.dnsd.me kibana4[7121]: {"type":"log","@timestamp":"2015-12-27T22:40:02+00:00","tags":["status","plugin:elasticsearch","info"],"pid":7121,"name":"plugin:elasticsearch","state":"green","message":"Status changed from yellow to green - Kibana index ready","prevState":"yellow","prevMsg":"Waiting for Elasticsearch"}
Forward Logs to Logstash
I ended up just forwarding rsyslog to logstash locally. I know I could’ve installed filebeat and used that as a forwarder but I wanted to skip that. So I created the following file
┌─[elatov@puppet] - [/home/elatov] - [2015-12-27 03:45:38]
└─[0] <> cat /etc/rsyslog.d/logstash.conf
*.* @localhost:5000
To apply the above changes I restarted the service:
$ sudo systemctl restart rsyslog
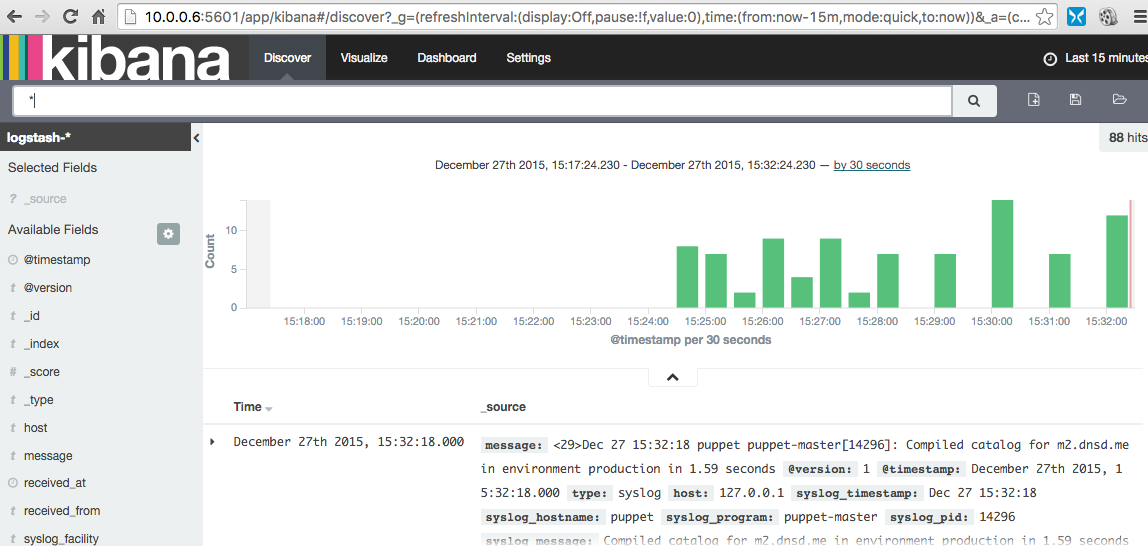
Then I went to kibana (http://<KIBABA_IP>:9200) and it was showing messages from my local machine:
Create a visualization
Some nice visualization starting guides:
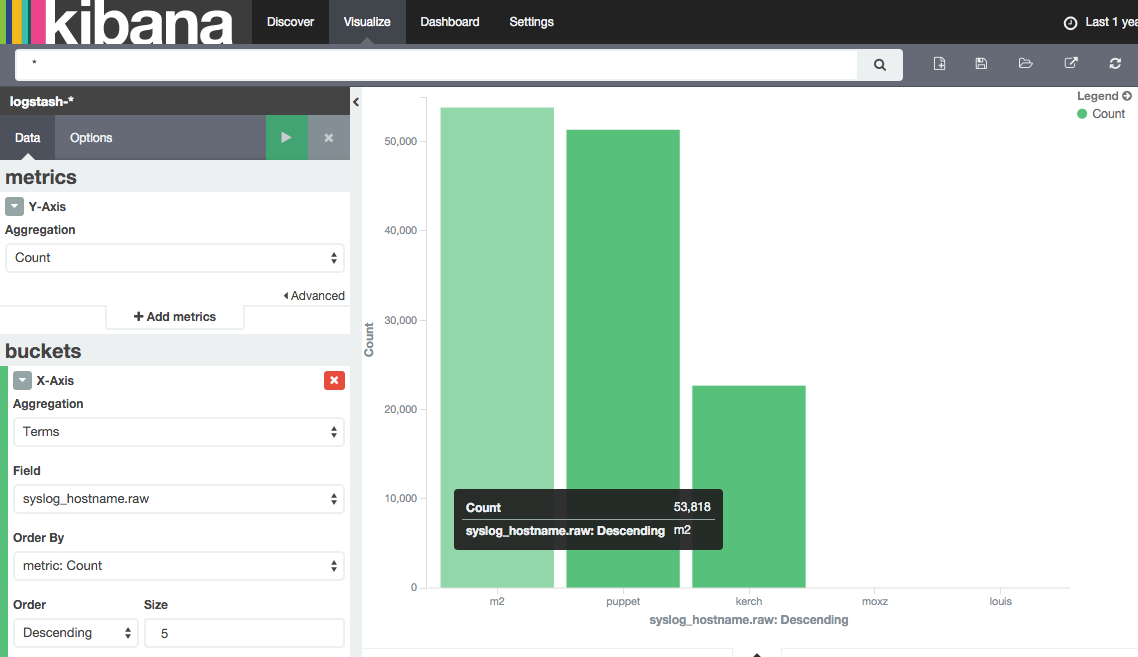
I wanted to create a simple bar chart that would just show me count of logs per host. So I ended up going to visualization and adding a vertical bar graph. I used the following options:
- y-axis
- Aggregation - Count
- x-axis
- Aggreation - Terms
- Field - syslog_hostname.raw
- Order by - Count
And I ended up creating this graph:
I then saved that.
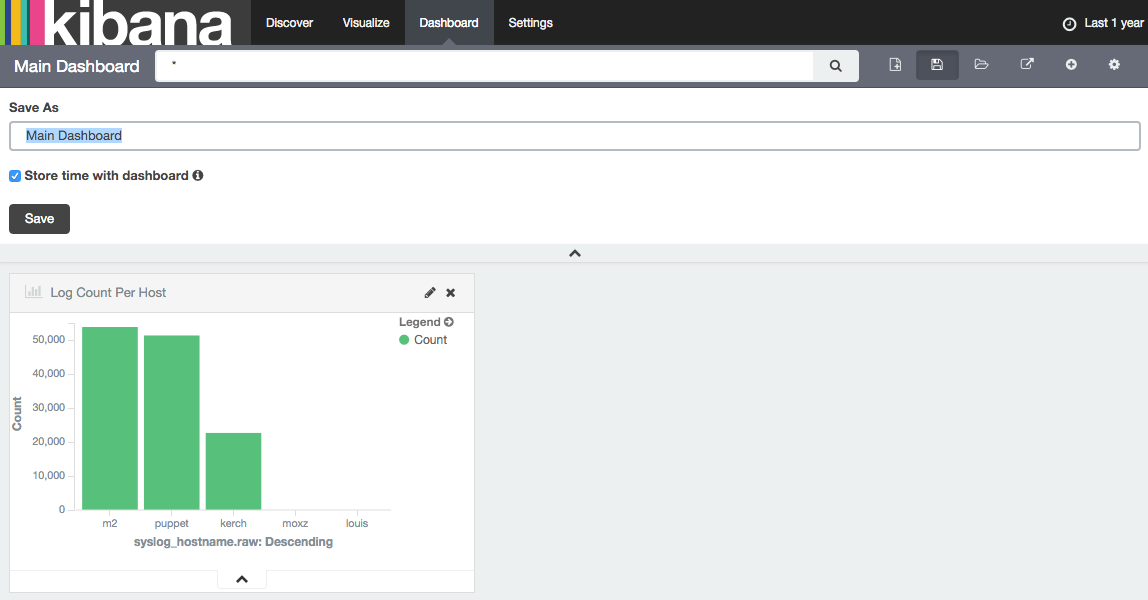
Create a Dashboard
Under dashboards I just added my visualization from above and when I saved it I made sure I enabled the “Store time with dashboard” option (since I didn’t want the count to show just what the time picker has selected):
Set a Saved Dashboard as the Default
If you want you can set a saved dashboard as the default application for kibaba. This way when any one logs into kibana they will see the dashboard and not the discover tab which allows you to search for logs. The instructions are laid out in this kibana github issue. I called my dashboard “Main-Dashboard”, so I set the following setting in the kibana config:
┌─[elatov@puppet] - [/home/elatov] - [2016-01-02 11:18:13]
└─[0] <> grep kibana.defaultAppId /opt/kibana/config/kibana.yml
# kibana.defaultAppId: "discover"
kibana.defaultAppId: "dashboard/Main-Dashboard"
Then after restarting the kibana service and visiting the kibana web ui and the default page was the dashboard.
Create a Saved Search
Most of the documentation is covered in the Discover section of the kibana documentation. Also a pretty nice guide at Kibana 4 Tutorial – Part 2: Discover.
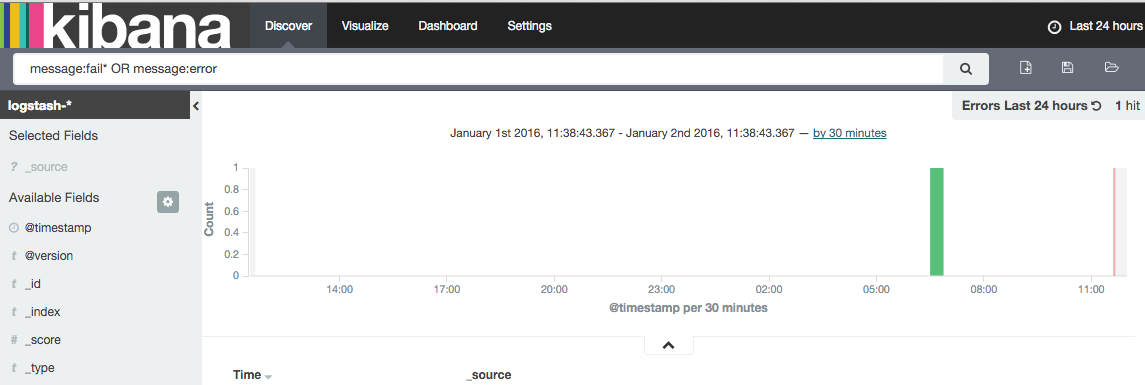
I wanted to create a search that would just show me failed or errors in the past 24 hours. So I set the time picker as last 24 hours and I searched for the following:
message:fail* OR message:error
and I saved that:
I tried adding that saved search to the dashboard, but I quickly realized that a dashboard can only have one time period. There is actually an enhancement request to allow to configure time per visualization rather than globally.
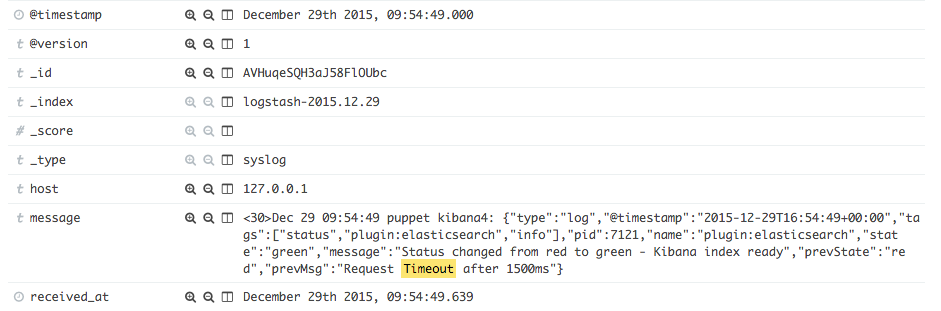
Fix Kibana Flapping
I was seeing random time outs between kibana and elasticsearch:
Dec 29 08:22:08 puppet kibana4[7121]: {"type":"log","@timestamp":"2015-12-29T15:22:08+00:00","tags":["status","plugin:elasticsearch","error"],"pid":7121,"name":"plugin:elasticsearch","state":"red","message":"Status changed from green to red - Request Timeout after 1500ms","prevState":"green","prevMsg":"Kibana index ready"}
So I ran into the forum: Kibana flapping between red and green which pointed to an known issue. I ended up trying the fix, which was to limit the memory for the kibana node:
┌─[elatov@puppet] - [/home/elatov] - [2016-01-03 05:56:17]
└─[0] <> tail -2 /opt/kibana/bin/kibana
NODE_OPTIONS="${NODE_OPTIONS:=--max-old-space-size=250}"
exec "${NODE}" $NODE_OPTIONS "${DIR}/src/cli" ${@}
Then after restarting kibana the issue went away (and I could even search for it in kibana):