Ossec Monitoring with Splunk and ELK
I decided to send my ossec alerts from my ossec server over syslog to visualize the alerts usage. As before, I will try using Splunk and ELK to see the difference.
Enable Ossec to send alerts over syslog
Most of the instructions are laid out in How to set up Syslog output and Syslog Output options. First let’s enable our ossec server to send syslogs to the splunk server and to the logstash server (edit the following file /usr/local/ossec-hids/etc/ossec.conf and add the following):
<syslog_output>
    <server>10.0.0.4</server>
    <port>5001</port>
    <format>splunk</format>
  </syslog_output>

  <syslog_output>
    <server>10.0.0.6</server>
    <port>5001</port>
    <format>default</format>
  </syslog_output>

</ossec_config>
Next let’s enable syslog on the ossec server:
┌─[elatov@moxz] - [/home/elatov] - [2016-01-23 11:47:52]
└─[0] <> sudo /usr/local/ossec-hids/bin/ossec-control enable client-syslog
Then restart the service:
┌─[elatov@moxz] - [/home/elatov] - [2016-01-23 11:47:59]
└─[0] <> sudo service ossec-hids restart
And lastly confirm it started up
┌─[elatov@moxz] - [/home/elatov] - [2016-01-23 11:48:55]
└─[0] <> grep ossec-csyslogd /usr/local/ossec-hids/logs/ossec.log
2016/01/23 11:48:07 ossec-csyslogd: INFO: Started (pid: 38590).
2016/01/23 11:48:07 ossec-csyslogd: INFO: Forwarding alerts via syslog to: '10.0.0.4:5001'.
2016/01/23 11:48:07 ossec-csyslogd: INFO: Forwarding alerts via syslog to: '10.0.0.6:5001'.
Next let’s move to the Splunk setup
Install Ossec App for Splunk
I had already played with the setup in one of my previous posts, this time around I decided to send remote logs rather than monitoring local files. Another good guide for the Splunk App install is here. After the app is installed let’s create the input source to receive the logs from the ossec server (add the following section to the /opt/splunk/etc/system/local/inputs.conf file)
[udp://10.0.0.3:5001]
disabled = false
sourcetype = ossec
Then restarting splunk applied that
sudo service splunk restart
Then going to the ossec dashboard:
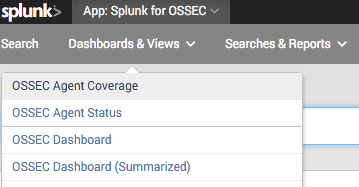
I saw all the summary:
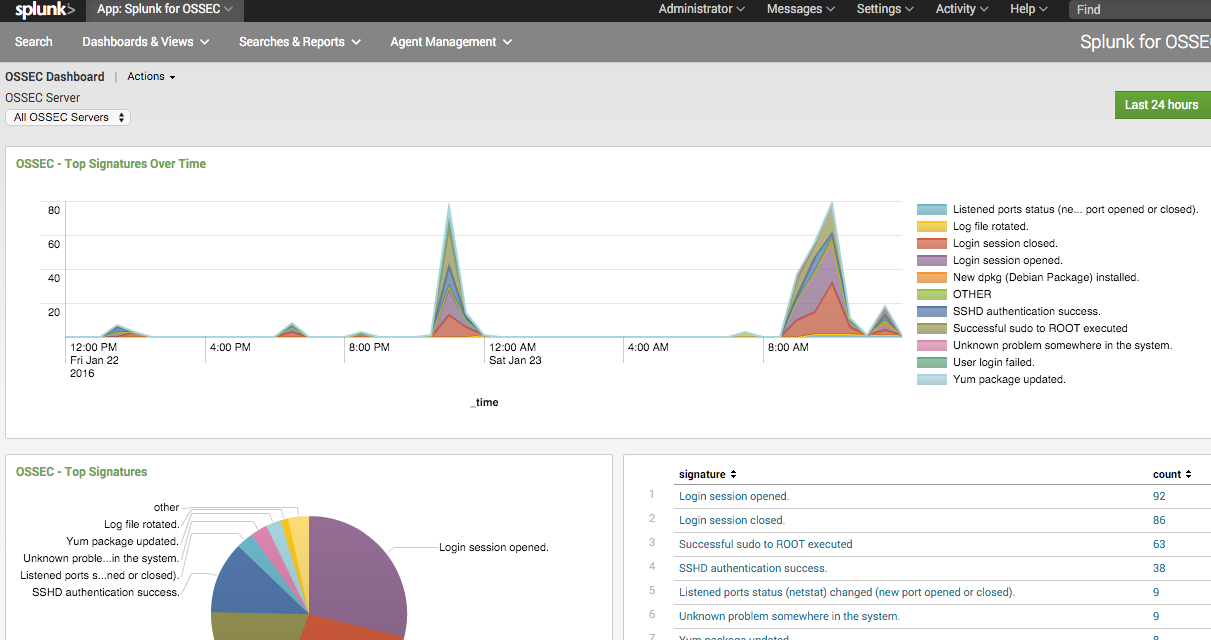
Pretty easy and nothing crazy.
Setup ELK to Monitor Ossec Logs
First let’s enable logstash to accept logs from the ossec server (the example is covered here). Here is the config I ended up with:
┌─[elatov@puppet] - [/home/elatov] - [2016-01-23 01:35:10]
└─[0] <> cat /etc/logstash/conf.d/ossec-syslog.conf
input {
# stdin{}
  udp {
     port => 5001
     type => "ossec"
  }
}

filter {
  if [type] == "ossec" {
    grok {
      match => { "message" => "%{SYSLOGTIMESTAMP:syslog_timestamp} %{SYSLOGHOST:syslog_host} %{DATA:syslog_program}: Alert Level: %{NONNEGINT:Alert_Level}; Rule: %{NONNEGINT:Rule} - %{DATA:Description}; Location: %{DATA:Location}; (user: %{USER:User};%{SPACE})?(srcip: %{IP:Src_IP};%{SPACE})?(user: %{USER:User};%{SPACE})?(dstip: %{IP:Dst_IP};%{SPACE})?(src_port: %{NONNEGINT:Src_Port};%{SPACE})?(dst_port: %{NONNEGINT:Dst_Port};%{SPACE})?%{GREEDYDATA:Details}" }
      add_field => [ "ossec_server", "%{host}" ]
    }
    mutate {
      remove_field => [ "message","syslog_timestamp", "syslog_program", "syslog_host", "syslog_message", "syslog_pid", "@version", "type", "host" ]
    }
  }
}

output {
  elasticsearch { hosts => ["localhost:9200"] }
  stdout { codec => rubydebug }
}
Now let’s restart logstash to apply the new change:
┌─[elatov@puppet] - [/home/elatov] - [2016-01-23 12:18:00]
└─[0] <> sudo service logstash restart
Killing logstash (pid 9057) with SIGTERM
Waiting logstash (pid 9057) to die...
Waiting logstash (pid 9057) to die...
Waiting logstash (pid 9057) to die...
logstash stopped.
logstash started.
Then fire off an ossec alert and you will see something similar to this in the logs under /var/log/logstash/logstash.stdout :
{
              "@timestamp" => "2016-01-23T19:39:10.000Z",
         "syslog_hostname" => "moxz",
             "received_at" => "2016-01-23T19:39:12.864Z",
           "received_from" => "10.0.0.3",
    "syslog_severity_code" => 5,
    "syslog_facility_code" => 1,
         "syslog_facility" => "user-level",
         "syslog_severity" => "notice",
             "Alert_Level" => "5",
                    "Rule" => "5503",
             "Description" => "User login failed.",
                "Location" => "(gen) 192.168.1.114->/var/log/messages",
                 "Details" => "Jan 23 12:39:09 gen xscreensaver[3649]: pam_unix(
xscreensaver:auth): authentication failure; logname= uid=xxx euid=xxx tty=:0.0
 ruser= rhost=  user=elatov",
            "ossec_server" => "10.0.0.3"
}
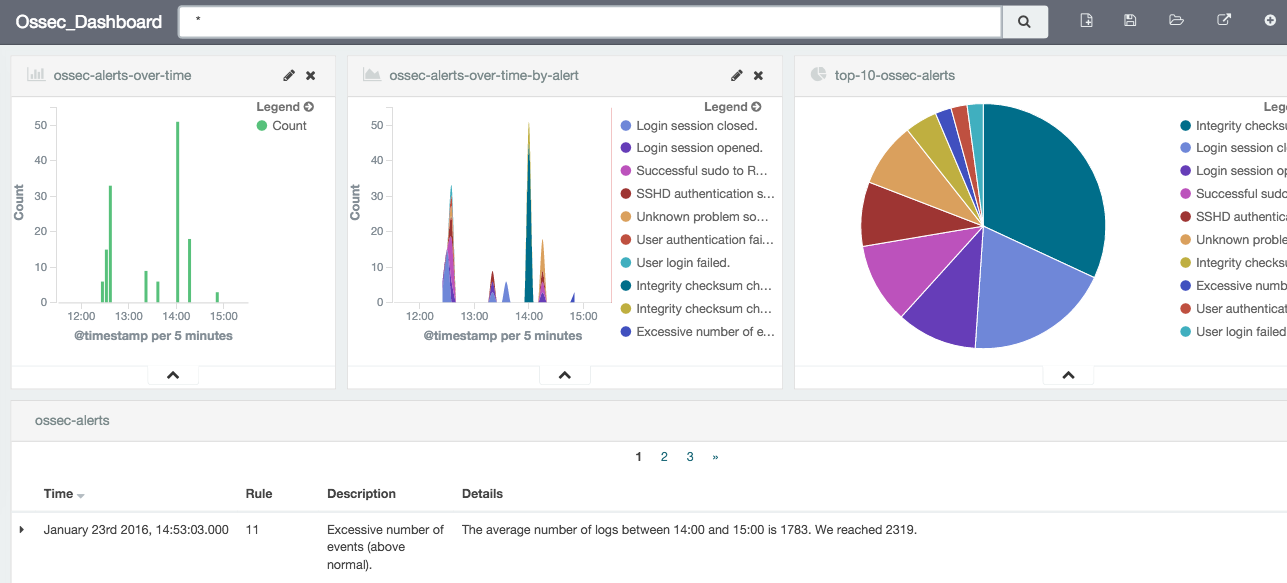
Create a Kibana 4 Dashboard For Ossec
To create the dashboard we can follow the instructions laid out here. Here is what I added for my search:
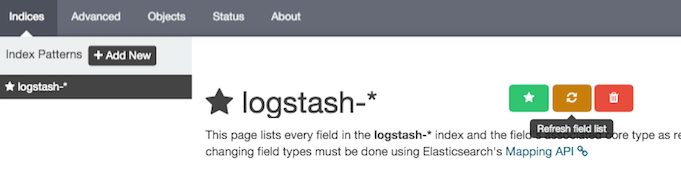
Before adding a visualization make sure you update your field list. There is a request to automatically do this, but I just did it manually. Go to Settings -> Indices -> logstash-* -> Refresh Field List:
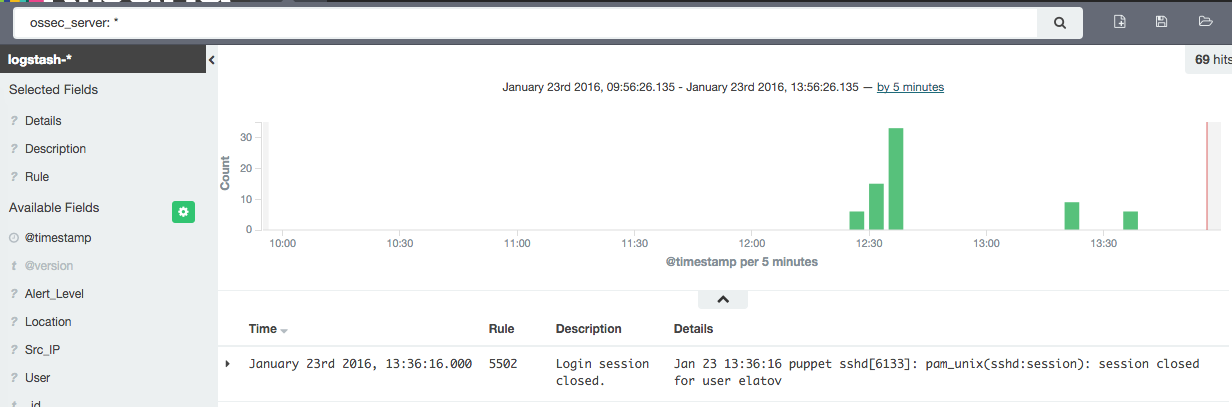
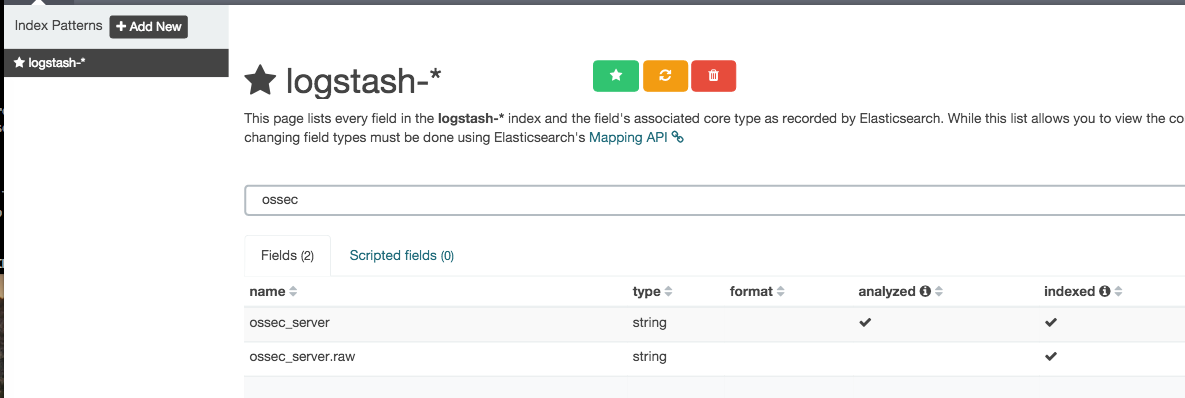
After that the fields will be available for visualizations and you can even search for the ossec_server one which is added by logstash:
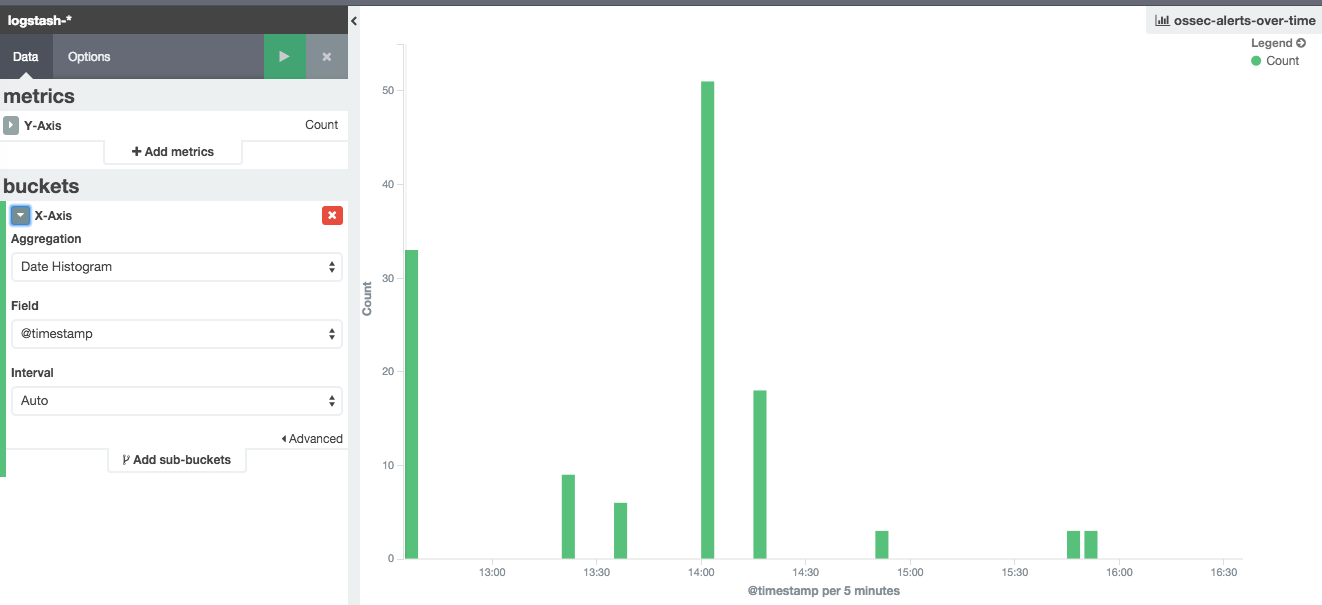
Here is the count vertical graph:
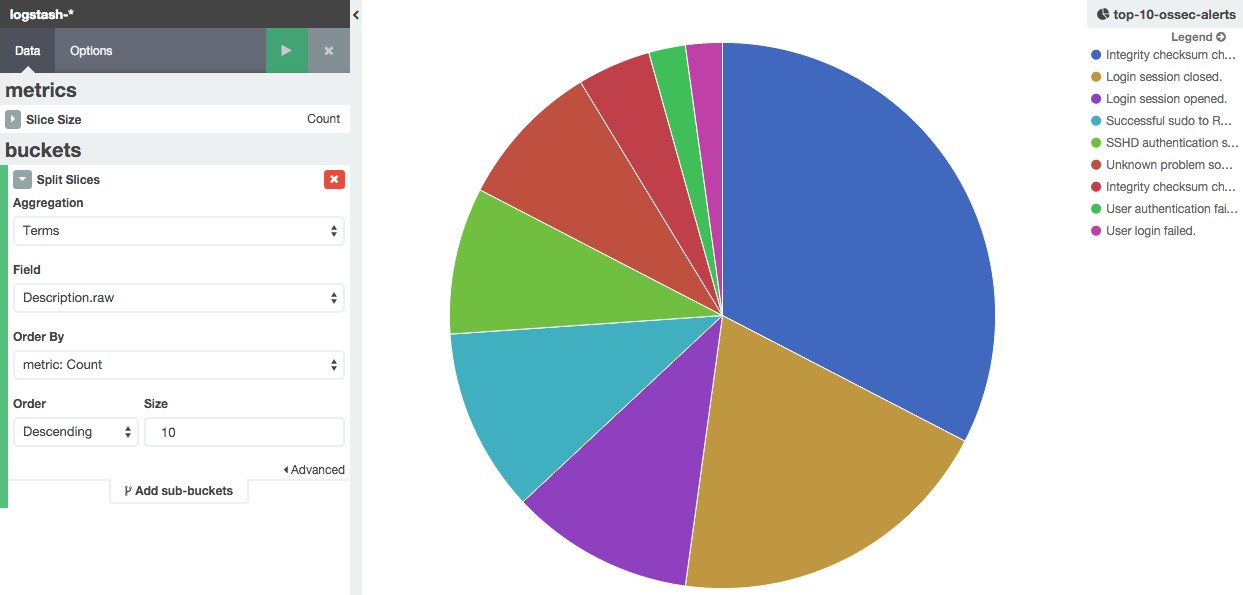
Here is the pie chart visualization:
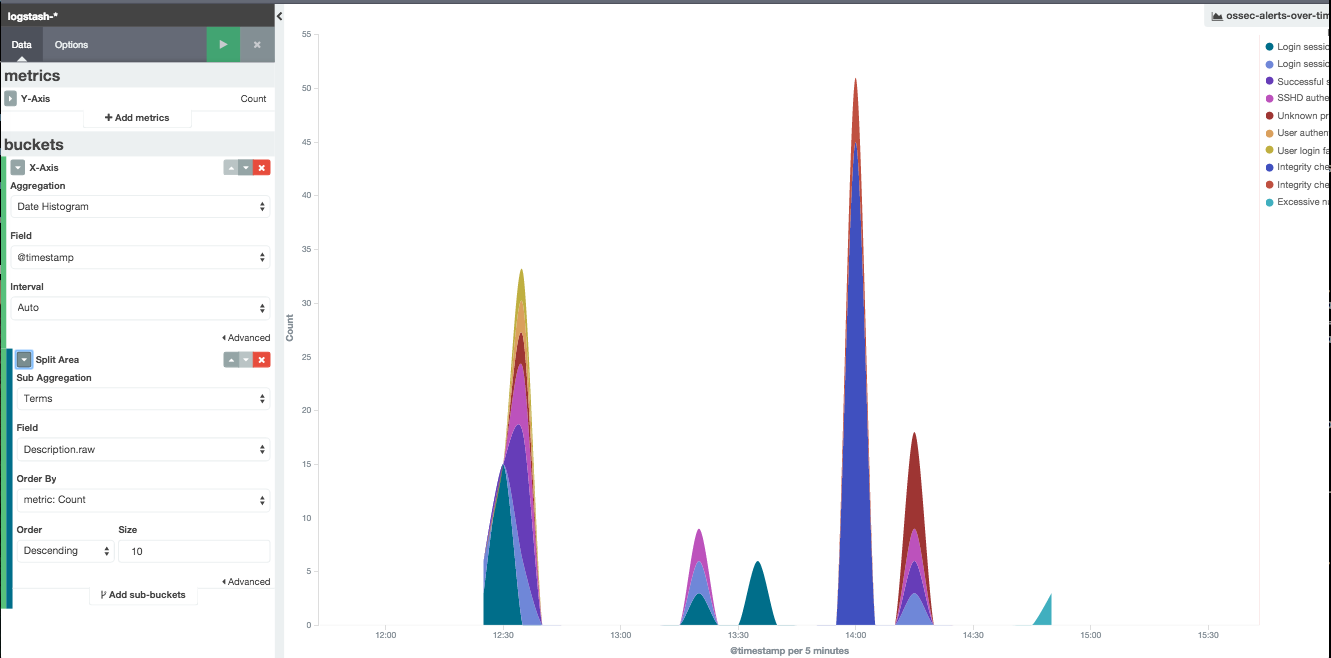
I also added a stacked graph for fun the instuctions are laid out here:
And in the end here is the dashboard I ended up with: