Suricata Logs in Splunk and ELK
I decided to use another tool to visualize the suricata events. Recently I started using ELK but I still kept my Splunk setup just for comparison.
Enable JSON output for Suricata
This is covered in Eve JSON Output, we just have to enable it in the config:
┌─[elatov@moxz] - [/home/elatov] - [2016-01-16 10:34:02]
└─[0] <> grep eve-log\: /usr/local/etc/suricata/suricata.yaml -A 24
  - eve-log:
      enabled: yes
      type: file #file|syslog|unix_dgram|unix_stream
      filename: eve.json
      # the following are valid when type: syslog above
      #identity: "suricata"
      #facility: local5
      #level: Info ## possible levels: Emergency, Alert, Critical,
                   ## Error, Warning, Notice, Info, Debug
      types:
        - alert
        - http:
            extended: yes     # enable this for extended logging information
            # custom allows additional http fields to be included in eve-log
            # the example below adds three additional fields when uncommented
            #custom: [Accept-Encoding, Accept-Language, Authorization]
        - dns
        - tls:
            extended: yes     # enable this for extended logging information
        - files:
            force-magic: no   # force logging magic on all logged files
            force-md5: no     # force logging of md5 checksums
        #- drop
        - ssh
After that we can also setup a log rotation configuration to make sure that file doesn’t get too big (this is covered in Log Rotation):
┌─[elatov@moxz] - [/home/elatov] - [2016-01-16 10:34:06]
└─[0] <> tail -1 /etc/newsyslog.conf.d/suricata
/var/log/suricata/eve.json  root:wheel  644 2 100 * JB /var/run/suricata.pid 1
Then to apply the changes let’s restart the necessary daemons:
sudo service newsyslog restart
sudo service suricata restart
Splunk App for Suricata
I ran into this guide about the setup: A Suricata application for Splunk. You can download the plugin from here:
wget https://www.stamus-networks.com/wp-content/uploads/2014/07/suristamus.spl
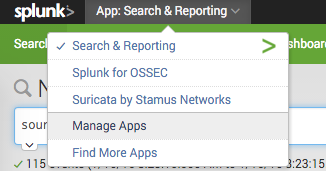
Then from the splunk UI just go to the application section (App: Search and Reporting -> Manage Apps):
Then click on Install App from File:
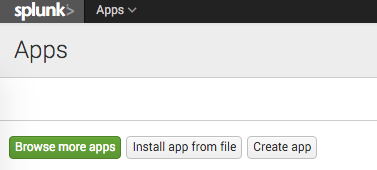
And point to the download file. After that’s installed, let’s create a suricata type to parse the JSON file (as described in Suricata and Ulogd meet Logstash and Splunk):
┌─[elatov@moxz] - [/home/elatov] - [2016-01-16 10:24:01]
└─[0] <> sudo cat /opt/splunk/etc/system/local/props.conf
[suricata]
KV_MODE = json
NO_BINARY_CHECK = 1
TRUNCATE = 0
And now let’s create an input source pointing to our file:
┌─[elatov@moxz] - [/home/elatov] - [2016-01-16 10:24:48]
└─[1] <> sudo cat /opt/splunk/etc/system/local/inputs.conf
[monitor:///var/log/suricata/eve.json]
sourcetype = suricata
host = moxz
disabled = false
Then go ahead and restart splunk to apply the new settings:
┌─[elatov@moxz] - [/home/elatov] - [2016-01-16 10:26:24]
└─[0] <> sudo service splunk restart
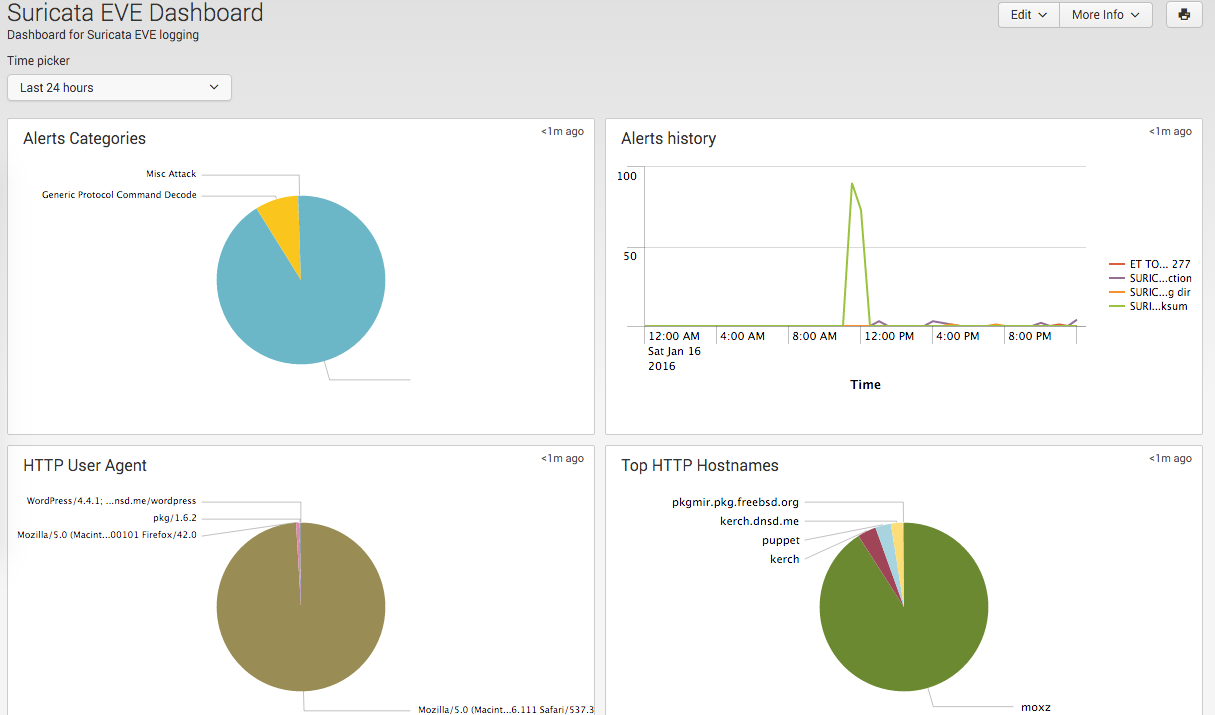
Then after some time you will see a bunch of pretty graphs:
ELK Configuration for Suricata
There are a couple of configuration parts to the setup. There is actually a pretty good guide at Logstash Kibana and Suricata JSON output.
Configure Filebeat on FreeBSD
I wasn’t running my ELK stack on the same machine as suricata so I decided to use Filebeat to send the json file to my logstash server. I found the binary here. After I downloaded it, I made a separate directory for the install:
mkdir -p /usr/local/filebeat/{bin,etc}
Copied the binary to the bin directory:
┌─[elatov@moxz] - [/home/elatov] - [2016-01-16 10:56:10]
└─[0] <> sudo mv filebeat-freebsd-amd64 /usr/local/filebeat/bin/filebeat
And then created the following config with the help of the Logstash documentation: Migrating from Logstash Forwarder to Filebeat:
┌─[elatov@moxz] - [/home/elatov] - [2016-01-16 10:59:23]
└─[0] <> cat /usr/local/filebeat/etc/filebeat.yml
filebeat:
  prospectors:
    -
      paths:
        - /var/log/suricata/eve.json

output:
  logstash:
    hosts: ["10.0.0.6:5044"]
To start it up I just had to run the following (this was after I configured logstash to accept this input):
┌─[elatov@moxz] - [/home/elatov] - [2016-01-16 10:56:45]
└─[2] <> nohup /usr/local/filebeat/bin/filebeat -c /usr/local/filebeat/etc/filebeat.yml &
I also ended up creating a service file for filebeat:
┌─[elatov@moxz] - [/home/elatov] - [2016-01-30 09:31:20]
└─[0] <> cat /usr/local/etc/rc.d/filebeat
#!/bin/sh
#

# PROVIDE: filebeat
# REQUIRE: LOGIN
# KEYWORD: shutdown

#
# Add the following lines to /etc/rc.conf to enable the filebeat agent:
#
# filebeat_enable="YES"

. /etc/rc.subr

name="filebeat"
rcvar=filebeat_enable

load_rc_config "$name"

: ${filebeat_enable="NO"}

command="/usr/local/filebeat/bin/filebeat"
command_args="-e -c /usr/local/filebeat/etc/filebeat.yml"
start_cmd=filebeat_start
pidfile="/var/run/${name}.pid"

filebeat_start() {
	echo "Starting filebeat."
	/usr/sbin/daemon -c -f -p $pidfile ${command} ${command_args}
}

run_rc_command "$1"
Then I enabled it to start on boot:
┌─[elatov@moxz] - [/home/elatov] - [2016-01-30 09:31:31]
└─[0] <> grep filebeat /etc/rc.conf
filebeat_enable="YES"
And then I could use the regular service commands to start/stop/check status of the filebeat service:
┌─[elatov@moxz] - [/home/elatov] - [2016-01-30 09:32:04]
└─[0] <> sudo service filebeat status
filebeat is running as pid 19908.
Configure LogStash to Receive JSON from FileBeat
On the ELK server I added the following configuration:
┌─[elatov@puppet] - [/home/elatov] - [2016-01-16 11:05:09]
└─[0] <> cat /etc/logstash/conf.d/suricata-beats.conf
input {
   beats {
     type => SuricataIDPS
     port => 5044
     codec => json
   }
}

filter {
  if [type] == "SuricataIDPS" {
    date {
      match => [ "timestamp", "ISO8601" ]
    }
    ruby {
      code => "if event['event_type'] == 'fileinfo'; event['fileinfo']['type']=event['fileinfo']['magic'].to_s.split(',')[0]; end;"
    }
  }

  if [src_ip]  {
    geoip {
      source => "src_ip"
      target => "geoip"
      #database => "/opt/logstash/vendor/geoip/GeoLiteCity.dat"
      add_field => [ "[geoip][coordinates]", "%{[geoip][longitude]}" ]
      add_field => [ "[geoip][coordinates]", "%{[geoip][latitude]}"  ]
    }
    mutate {
      convert => [ "[geoip][coordinates]", "float" ]
    }
    if ![geoip.ip] {
      if [dest_ip]  {
        geoip {
          source => "dest_ip"
          target => "geoip"
          #database => "/opt/logstash/vendor/geoip/GeoLiteCity.dat"
          add_field => [ "[geoip][coordinates]", "%{[geoip][longitude]}" ]
          add_field => [ "[geoip][coordinates]", "%{[geoip][latitude]}"  ]
        }
        mutate {
          convert => [ "[geoip][coordinates]", "float" ]
        }
      }
    }
  }
}

output {
  elasticsearch { hosts => ["localhost:9200"] }
  stdout { codec => rubydebug }
}
And then restarted the service to apply the new settings (also don’t forget the iptables configuration to allow tcp port 5044):
sudo systemctl restart logstash
Then I was checking out the /var/log/logstash/logstash.stdout file and I saw the following:
{
     "timestamp" => "2016-01-16T10:47:07.711166-0700",
       "flow_id" => 2270329344,
      "in_iface" => "em0",
    "event_type" => "http",
        "src_ip" => "10.0.0.3",
      "src_port" => 40328,
       "dest_ip" => "96.47.72.71",
     "dest_port" => 80,
         "proto" => "TCP",
         "tx_id" => 0,
          "http" => {
               "hostname" => "pkgmir.pkg.freebsd.org",
                    "url" => "/FreeBSD:10:amd64/latest/packagesite.txz",
        "http_user_agent" => "pkg/1.6.2",
            "http_method" => "GET",
               "protocol" => "HTTP/1.1",
                 "status" => 304,
                 "length" => 0
    },
     "@version" => "1",
    "@timestamp" => "2016-01-16T17:47:08.414Z",
          "beat" => {
        "hostname" => "moxz.dnsd.me",
            "name" => "moxz.dnsd.me"
    },
         "count" => 1,
        "fields" => nil,
    "input_type" => "log",
        "offset" => 5029908,
        "source" => "/var/log/suricata/eve.json",
          "type" => "log",
          "host" => "moxz.dnsd.me",
         "geoip" => {
                      "ip" => "96.47.72.71",
           "country_code2" => "US",
           "country_code3" => "USA",
            "country_name" => "United States",
          "continent_code" => "NA",
             "region_name" => "NY",
               "city_name" => "New York",
             "postal_code" => "10038",
                "latitude" => 40.7089,
               "longitude" => -74.0012,
                "dma_code" => 501,
               "area_code" => 212,
                "timezone" => "America/New_York",
        "real_region_name" => "New York",
                "location" => [
            [0] -74.0012,
            [1] 40.7089
        ],
             "coordinates" => [
            [0] -74.0012,
            [1] 40.7089
        ]
    }
}
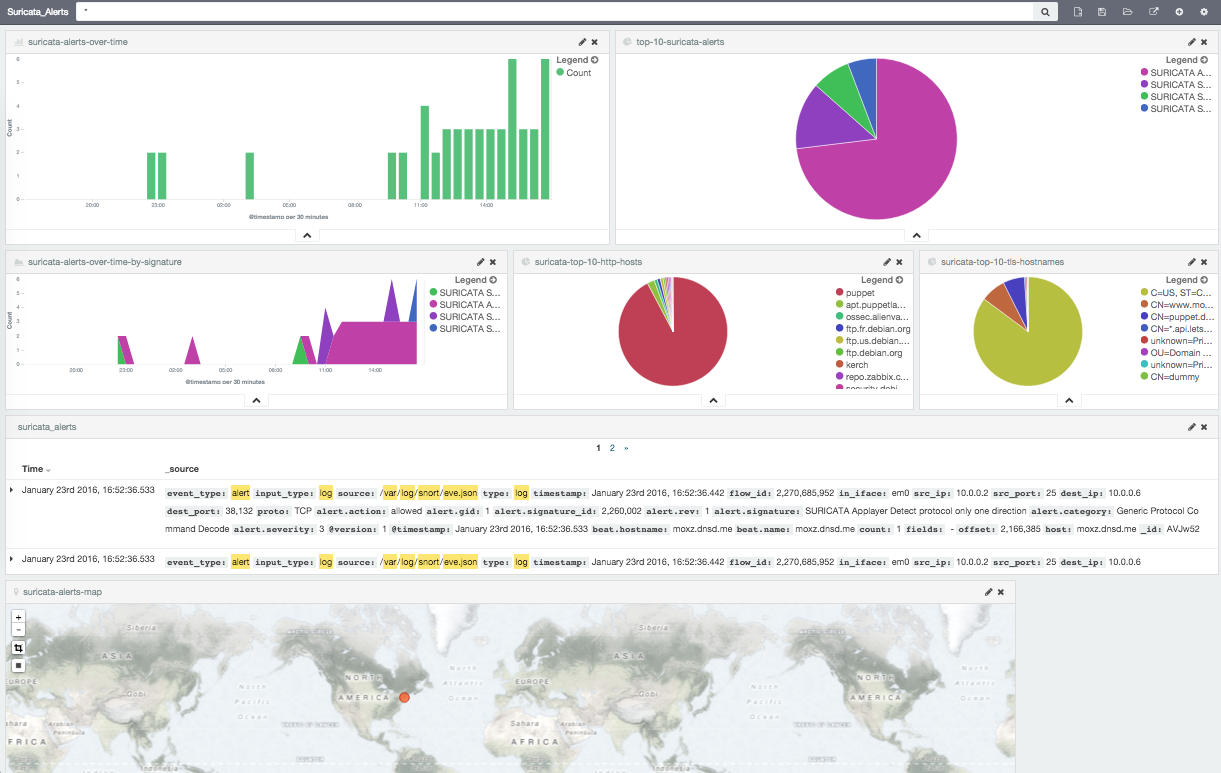
Pretty cool. In the Suricata guide there are a bunch of Kibana Templates but they were created for Kibana version 3 and I was running Kibana 4, so I couldn’t use them as per this discussion. I created my own, it wasn’t as extensive but it was good enough for me:
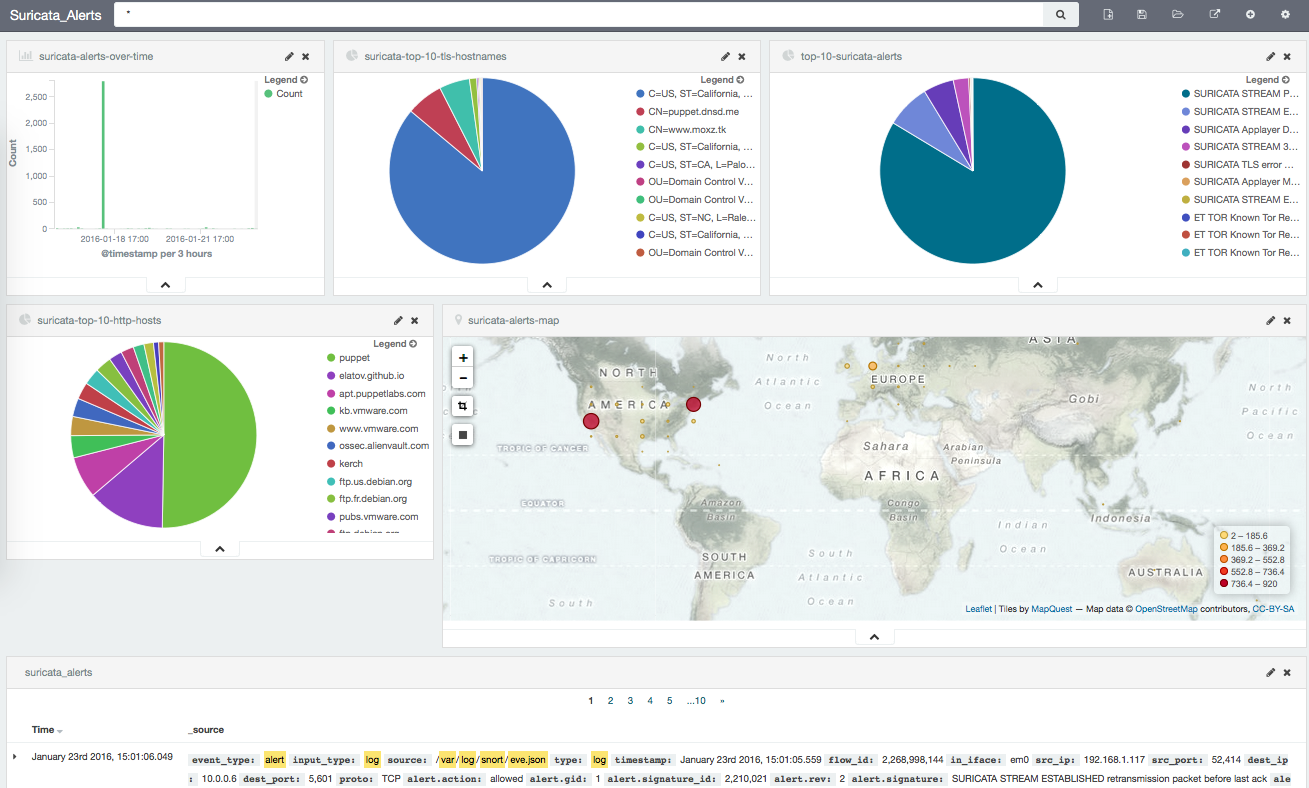
Here is another view after moving some stuff around: