Email DD-WRT Monthly Bandwidth Usage
Bandwidth Usage in DD-WRT
I decided to keep an eye on my bandwidth usage. By default dd-wrt provides a pretty nice graph under Status -> WAN -> Traffic by Month:
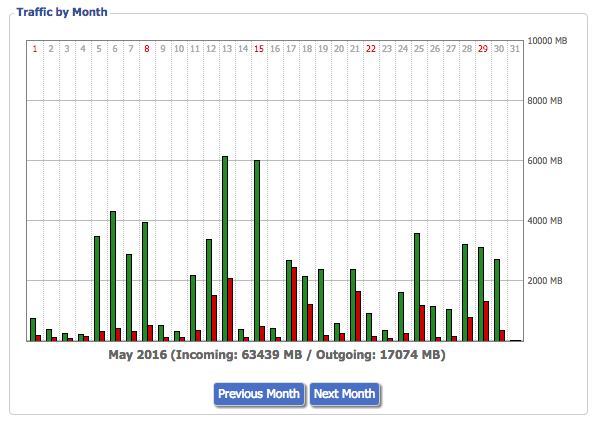
The graph has everything that I needed (per day break down and the total usage for the whole month). The data is collected by ttraff and by default it’s enabled under Services -> Services -> WAN Traffic Counter:

DD-WRT SSH Authorized Keys and ttraff
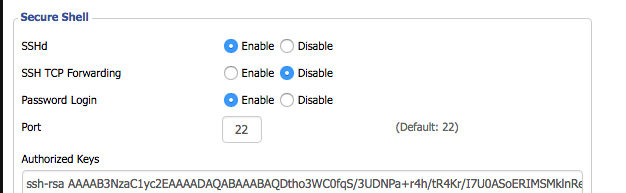
I wanted to email such a graph on a monthly basis. So I decided to put together a script which will grab the ttraff data, plot it, and email it. The first thing we need to do is enable ssh keys for remote access. I created ssh keys and added them under Services -> Services -> Secure Shell:
After that I could query ttraff data without any issue:
┌─[elatov@kerch] - [/home/elatov] - [2016-05-30 07:34:35]
└─[0] <> ssh wrt -q 'nvram get traff-10-2015'
1800:550 73:36 3543:471 166:44 191:39 1039:253 102:38 2378:385 2387:258 2903:322 3799:1565 360:58 2703:1232 1363:265 2561:794 7343:1628 1865:110 84:35 190:39 70:34 95:66 135:35 78:34 48:67 52:32 315:80 69:39 293:80 590:40 584:64 11608:1016 [48787:9709]
The data is described at WAN Traffic By Month, from that page:
Notice the naming: traff-mm-yyyy, where mm is month and yyyy is year. The data for each day is kept in pairs of inbound / outbound megabytes. 7322:3488 is for June 1 2008, 7322 MB incoming, 3488 MB outgoing.
At the end the sum is included surrounded by square brackets ([]).
GnuPlot Settings
I have used gnuplot in the past (here) and it’s pretty powerful, this time around I decided to put together a script. After checking out some web pages:
- Formatting labels with disk size information
- How to export Gnuplot output to png, jpg and pdf
- gnuplot demo script:histograms.dem
I ended up with the following:
set title "Sept 2015 (Incoming: 46222MB Outgoing: 11615MB)
set terminal png size 800,600 enhanced font "Helvetica,10"
set output 'output.png'
set grid
set style data histogram
set style histogram cluster gap 2
set style fill solid border -1
set boxwidth 1.1
set xtic scale 0
set format y "%.0s%cB"
plot "traf.dat" using 2:xtic(1) title "Incoming",""using 3:xtic(1) title "Outgoing"
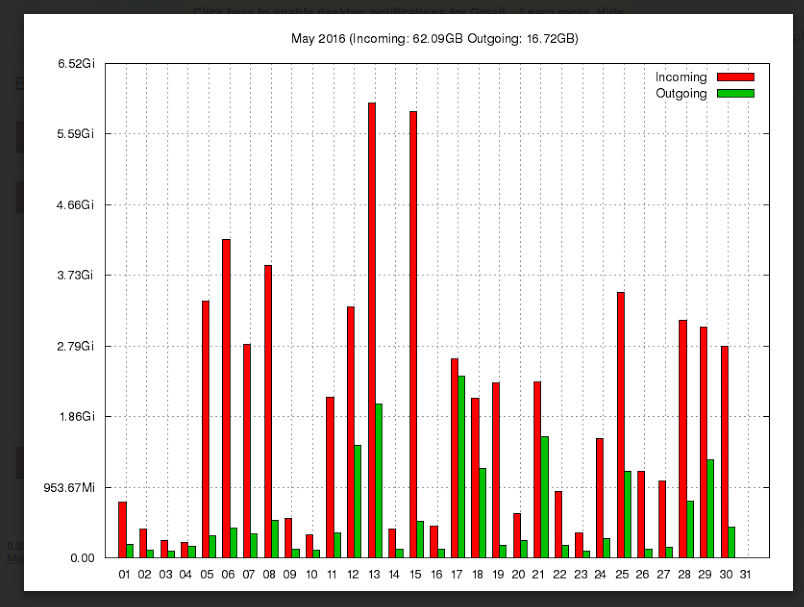
and I actually ended up with the following graph:
Here is the data I was playing with initially:
01 314000000 58000
02 556000000 69000000
03 872000000 129000000
04 531000000 65000000
05 2907000000 420000000
06 1212000000 254000000
07 3632000000 1806000000
08 727000000 80000000
09 355000000 24000000
10 990000000 169000000
I did the following:
- Prepend it with Day of Month
- Change the Colon to a Space
- Append 6 zeros to each value to convert it into bytes
After checking out the help section of gnuplot, I realized there was already a format for the desired notation:
The acceptable formats (if not in time/date mode) are:
   Format       Explanation
   %f           floating point notation
   %e or %E     exponential notation; an "e" or "E" before the power
   %g or %G     the shorter of %e (or %E) and %f
   %x or %X     hex
   %o or %O     octal
   %t           mantissa to base 10
   %l           mantissa to base of current logscale
   %s           mantissa to base of current logscale; scientific power
   %T           power to base 10
   %L           power to base of current logscale
   %S           scientific power
   %c           character replacement for scientific power
   %b           mantissa of ISO/IEC 80000 notation (ki, Mi, Gi, Ti, Pi, Ei, Zi, Yi)
   %B           prefix of ISO/IEC 80000 notation (ki, Mi, Gi, Ti, Pi, Ei, Zi, Yi)
   %P           multiple of pi
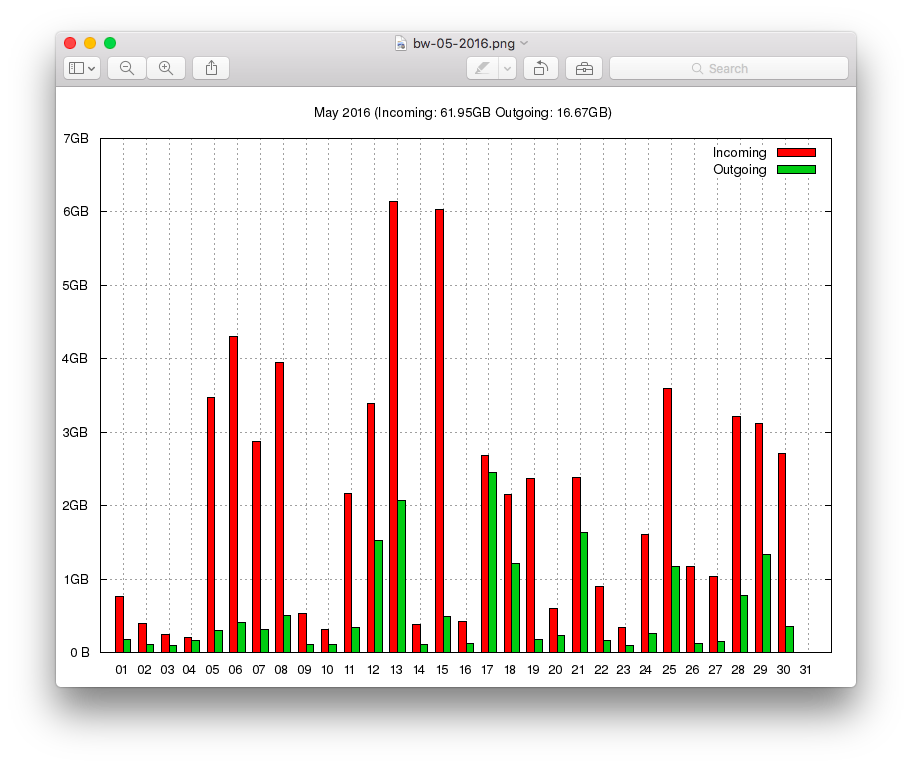
So after that I ended up with this:
set format y '%.2b%B'
And that produced the following graph:
I also ended up multiplying the values by 1024 twice to convert from megabytes to bytes instead of just appending 6 zeros.
Bash Script
After playing around with some settings I ended up with the following script:
#!/bin/bash
# Global Variables
LAST_MONTH=$(/bin/date -d '-2 days' "+%m-%Y")
LAST_MONTH_M=$(/bin/date -d '-2 days' "+%b")
LAST_MONTH_Y=${LAST_MONTH#*-}

# Get the Data from WRT (Assumes ssh keys are in place)
DATA=$(/usr/bin/ssh -q wrt "nvram get traff-$LAST_MONTH")
DATA_FILE="/tmp/bw-"$LAST_MONTH".data"

# Sample DATA
#DATA="1139:972 5872:548 1050:216 439:116 227:213 1815:479 5151:1447 976:294 6004:531 492:86 334:101 1574:184 879:118 297:85 1014:190 7706:489 592:122 411:100 107:64 1409:270 1428:205 2887:146 3192:314 783:85 707:124 1838:243 1780:314 3147:369 2768:399 8230:1304 [64248:10128]"

# Convert data string to Array
ARR_DATA=($DATA)

# Get the last element of the array
ARR_DATA_SUM=${ARR_DATA[${#ARR_DATA[@]}-1]}

# remove the last element of the array, since that's the sum data
unset ARR_DATA[${#ARR_DATA[@]}-1]

# Copy Array into another array
ARR_DATA_POINTS=(${ARR_DATA[@]})

# Print the data to be plotted, increment index since we start at zero
for i in "${!ARR_DATA_POINTS[@]}"; do
	# get substring before colon
	IN_MB=${ARR_DATA_POINTS[$i]%:*}
	# get substring after colon
	OUT_MB=${ARR_DATA_POINTS[$i]#*:}
	# convert megabytes to bytes
	IN_B=$(($IN_MB * 1024 * 1024))
	OUT_B=$(($OUT_MB * 1024 * 1024))
	printf "%02d %s %s\n" "$(($i+1))" "$IN_B" "$OUT_B" >> $DATA_FILE
done

# Remove square brakets from the Sum Array
ARR_DATA_SUM=( "${ARR_DATA_SUM[@]/#[/}" )
ARR_DATA_SUM=( "${ARR_DATA_SUM[@]/%]/}" )

# Grab substings for incoming and outgoing values
TOT_IN_MB=${ARR_DATA_SUM%:*}
TOT_OUT_MB=${ARR_DATA_SUM#*:}

# Convert to GB without decimals
# didn't use this
#TOT_IN_GB=$(($TOT_IN_MB/1024))
#TOT_OUT_GB=$(($TOT_OUT_MB/1024))

# convert to GB with decimals
TOT_IN_GB=$(echo "scale=2; $TOT_IN_MB / 1024" | /usr/bin/bc)
TOT_OUT_GB=$(echo "scale=2; $TOT_OUT_MB / 1024" | /usr/bin/bc)

GNUPLOT_OUTPUT="/tmp/bw-"$LAST_MONTH".png"
GNUPLOT_SCRIPT='set title "'$LAST_MONTH_M' '$LAST_MONTH_Y' (Incoming: '$TOT_IN_GB'GB Outgoing: '$TOT_OUT_GB'GB)"\n
set terminal png size 800,600 enhanced font "Helvetica,10"\n
set output "'$GNUPLOT_OUTPUT'"\n
set grid\n
set style data histogram\n
set style histogram cluster gap 1\n
set style fill solid border -1 \n
set xtic scale 0\n
set format y "%.2b%B"\n
plot "'$DATA_FILE'" using 2:xtic(1) title "Incoming",""using 3:xtic(1) title "Outgoing"'
GNUPLOT_SCRIPT_FILE="/tmp/bw.gnu"

# Create gnuplot script
echo -e $GNUPLOT_SCRIPT >> $GNUPLOT_SCRIPT_FILE

# Generate the graph
/usr/bin/gnuplot $GNUPLOT_SCRIPT_FILE

if [ $? -ne 0 ]; then
	echo "GnuPlot Failed, exiting"
	exit 1
fi

# Send email
echo "BW Summary" | /usr/bin/mailx -s "BW Usage for $LAST_MONTH_M $LAST_MONTH_Y" -a $GNUPLOT_OUTPUT elatov

if [ $? -ne 0 ]; then
    echo "Email Failed, exiting"
    exit 1
fi

# clean up
/bin/rm $GNUPLOT_SCRIPT_FILE $DATA_FILE $GNUPLOT_OUTPUT

if [ $? -ne 0 ]; then
    echo "clean-up Failed, exiting"
    exit 1
fi
Here are the tools necessary for the script:
┌─[elatov@kerch] - [/home/elatov] - [2016-05-30 08:35:29]
└─[0] <> dpkg -l | grep -E ' bc |gnuplot |mailx'
ii  bc                1.06.95-9   amd64    GNU bc arbitrary precision calculator language
ii  gnuplot           4.6.6-2     all      Command-line driven interactive plotting program
ii  heirloom-mailx    12.5-4      amd64    feature-rich BSD mail(1)
If you really like the way the graph looks like with the Gigabytes output here is what you can do to auto append 6 zeroes to each element of the array:
# Replace all colons (:) with spaces and append 6 0s for MB
ARR_DATA_POINTS=( "${ARR_DATA_POINTS[@]/:/000000 }" )
ARR_DATA_POINTS=( "${ARR_DATA_POINTS[@]/%/000000}" )
Adding a Cron Job
The last thing to do is to just add that script to be run from cron. I decided to run that on the first day of the month (that way the script will get the right values for the month variables):
┌─[elatov@kerch] - [/home/elatov] - [2016-05-30 08:23:12]
└─[0] <> crontab -l | tail -1
00 03 1 * * /usr/local/bin/pl-traf