Monitoring Other Targets with Prometheus
I slowly started using prometheus for monitoring my kubernetes cluster and I realized I wanted to use prometheus for other targets: solaris machines, S.M.A.R.T attributes, and VMware. As I was doing research I actually ran into each of targets covered one way or another. I will try to break these down into a section.
Compiling node_exporter on OmniOS
I was still using OmniOS for my storage and I wanted to monitor some metrics of the machine. I soon realized that node_exporter doesn’t provide solaris builds. So I decided to compile it and to my surprise it wasn’t that bad. I saw that a couple of people ran into some compile issues:
- can’t compile on Solaris/SmartOS
- promu build does not work on SmartOS
- Failure when trying to cross compile for solaris
- Fix build on SmartOS by not setting gcc’s -static flag
- Build failed on SmartOS
I got lucky and with the latest version it worked out for me on my system:
> go version
go version go1.12.17 solaris/amd64
> uname -a
SunOS zfs.kar.int 5.11 omnios-r151032-19f7bd2ae5 i86pc i386 i86pc
Initially when I tried the build, I ran into the following error:
> export GOPATH=/tmp/go
> go get github.com/prometheus/node_exporter
> cd /tmp/go/src/github.com/prometheus/node_exporter
> make
>> checking code style
>> checking license header
>> running check for unused/missing packages in go.mod
GO111MODULE=on go mod tidy
warning: ignoring symlink /tmp/go/src/github.com/prometheus/node_exporter/collector/fixtures/proc/self
go: finding github.com/alecthomas/units v0.0.0-20190924025748-f65c72e2690d
go: finding github.com/prometheus/client_golang v1.4.1
...
...
+honnef.co/go/tools/go/types/typeutil
+honnef.co/go/tools/internal/renameio
make: *** [Makefile.common:193: common-unused] Error 1
This was covered in [Makefile.common:193: common-unused] Error 1, that was specific to the go version and there is a workaround to just run make build, so I gave that a try and I ran into this:
> make build
curl -s -L https://github.com/prometheus/promu/releases/download/v0.5.0/promu-0.5.0.solaris-amd64.tar.gz | tar -xvzf - -C /tmp/tmp.p3aqCn
tar: tape blocksize error
make: *** [Makefile.common:240: /tmp/go/bin/promu] Error 3
It tries to download a pre-built version of promu, but that doesn’t exist, so I decided to build that:
> go get github.com/prometheus/promu
go get: warning: modules disabled by GO111MODULE=auto in GOPATH/src;
        ignoring go.mod;
        see 'go help modules'
> make
>> checking code style
>> checking license header
>> running check for unused/missing packages in go.mod
GO111MODULE=on go mod tidy
go: finding github.com/prometheus/common v0.5.0
go: finding github.com/google/go-github/v25 v25.0.0
go: finding github.com/Masterminds/semver v1.4.2
 gopkg.in/alecthomas/kingpin.v2
 # gopkg.in/yaml.v2 v2.2.2
make: *** [Makefile.common:205: common-unused] Error 1
Same thing as with the prometheus build, so I decided to try a similar fix and it actually worked:
> make build
>> installing promu
GO111MODULE=on GOOS= GOARCH= go install github.com/prometheus/promu
>> rebuilding binaries using promu
GO111MODULE=on /tmp/go/bin/promu build --prefix /tmp/go/src/github.com/prometheus/promu
 >   promu
> /tmp/go/bin/promu version
promu, version  (branch: , revision: )
  build user:
  build date:
  go version:       go1.12.17
> ./promu version
promu, version 0.5.0 (branch: master, revision: 9842ddf39ec485393f6f18707ecc9b4d0e2defb1)
  build user:       root@zfs.kar.int
  build date:       20200423-23:53:17
  go version:       go1.12.17
Now back to building node_exporter:
> cd /tmp/go/src/github.com/prometheus/node_exporter
> make build
>> building binaries
GO111MODULE=on /tmp/go/bin/promu --config .promu-cgo.yml build --prefix /tmp/go/src/github.com/prometheus/node_exporter
 >   node_exporter
./node_exporter --version
node_exporter, version 1.0.0-rc.0 (branch: master, revision: fa4edd700ebc1b3614bcd953c215d3f2ab2e0b35)
  build user:       root@zfs.kar.int
  build date:       20200423-23:55:05
  go version:       go1.12.17
And starting it worked out as well:
> ./node_exporter
level=info ts=2020-04-23T23:56:37.181Z caller=node_exporter.go:176 msg="Starting node_exporter" version="(version=1.0.0-rc.0, branch=master, revision=fa4edd700ebc1b3614bcd953c215d3f2ab2e0b35)"
level=info ts=2020-04-23T23:56:37.181Z caller=node_exporter.go:177 msg="Build context" build_context="(go=go1.12.17, user=root@zfs.kar.int, date=20200423-23:55:05)"
level=info ts=2020-04-23T23:56:37.181Z caller=node_exporter.go:104 msg="Enabled collectors"
level=info ts=2020-04-23T23:56:37.181Z caller=node_exporter.go:111 collector=boottime
level=info ts=2020-04-23T23:56:37.181Z caller=node_exporter.go:111 collector=cpu
level=info ts=2020-04-23T23:56:37.181Z caller=node_exporter.go:111 collector=cpufreq
level=info ts=2020-04-23T23:56:37.181Z caller=node_exporter.go:111 collector=loadavg
level=info ts=2020-04-23T23:56:37.181Z caller=node_exporter.go:111 collector=textfile
level=info ts=2020-04-23T23:56:37.181Z caller=node_exporter.go:111 collector=time
level=info ts=2020-04-23T23:56:37.181Z caller=node_exporter.go:111 collector=zfs
level=info ts=2020-04-23T23:56:37.181Z caller=node_exporter.go:190 msg="Listening on" address=:9100
And I was able to get some basic metrics:
> curl -s localhost:9100/metrics | grep zfs
node_scrape_collector_duration_seconds{collector="zfs"} 0.003963611
..
# HELP node_zfs_abdstats_struct_bytes ZFS ARC buffer data struct size
# TYPE node_zfs_abdstats_struct_bytes gauge
node_zfs_abdstats_struct_bytes 2.6575312e+07
# HELP node_zfs_arcstats_anon_bytes ZFS ARC anon size
# TYPE node_zfs_arcstats_anon_bytes gauge
node_zfs_arcstats_anon_bytes 3.046144e+07
# HELP node_zfs_arcstats_c_bytes ZFS ARC target size
# TYPE node_zfs_arcstats_c_bytes gauge
node_zfs_arcstats_c_bytes 1.2358138552e+10
# HELP node_zfs_arcstats_c_max_bytes ZFS ARC maximum size
# TYPE node_zfs_arcstats_c_max_bytes gauge
node_zfs_arcstats_c_max_bytes 1.568845824e+10
# HELP node_zfs_arcstats_c_min_bytes ZFS ARC minimum size
# TYPE node_zfs_arcstats_c_min_bytes gauge
node_zfs_arcstats_c_min_bytes 1.96105728e+09
# HELP node_zfs_arcstats_data_bytes ZFS ARC data size
# TYPE node_zfs_arcstats_data_bytes gauge
...
...
# HELP node_zfs_zfetchstats_misses_total ZFS cache fetch misses
# TYPE node_zfs_zfetchstats_misses_total counter
node_zfs_zfetchstats_misses_total 7.6896705e+07
Now that we have node_exporter built and as we can see from the above output the textfile collector is enabled, let’s move to the next section.
Using the Textfile Collector to get S.M.A.R.T Attributes from Hard Drives
This part was actually lucky and there is sample script under the Text collector example scripts repository and I ended up grabbing the smartmon.py script from there. Running that provided all the necessary metrics:
> /usr/local/node_exporter/scripts/smartmon.py | grep temp
smartmon_attr_raw_value{disk="/dev/rdsk/c2t0d0s0",name="airflow_temperature_cel"} 46
smartmon_attr_raw_value{disk="/dev/rdsk/c2t0d0s0",name="temperature_celsius"} 46
smartmon_attr_raw_value{disk="/dev/rdsk/c2t1d0s0",name="airflow_temperature_cel"} 43
smartmon_attr_raw_value{disk="/dev/rdsk/c2t1d0s0",name="temperature_celsius"} 43
smartmon_attr_raw_value{disk="/dev/rdsk/c2t2d0s0",name="airflow_temperature_cel"} 43
Don’t forget to start node_exporter with the --collector.textfile.directory and put the output from the above script into a file ending in .prom. Also using with combination of a grafana dashboard you can see all of your stats:

VMware Perf Metrics with Prometheus
By default there are no exporter, so I ran into an open source python project called vmware-exporter. The project contains k8s manifests and it has instructions on how to deploy it:
# update the config-map with vSphere creds
vi config.yml
read -s VSPHERE_PASSWORD
kubectl create secret generic vmware-exporter-password --from-literal=VSPHERE_PASSWORD=$VSPHERE_PASSWORD
kubectl apply -f .
After it’s deployed you can either expose it as a service or just curl it directly (I did the latter since the prometheus server was able to reach the pod because of the prometheus.io/scrape: true annotation on the deployment):
> k get pods -l app=vmware-exporter -o wide
NAME                              READY   STATUS    RESTARTS   AGE   IP               NODE   NOMINATED NODE   READINESS GATES
vmware-exporter-5b5cb7755-h854j   1/1     Running   0          22h   10.244.154.213   kub2   <none>           <none>
> curl http://10.244.154.213:9272/metrics -s | grep -i latency
# HELP vmware_vm_disk_maxTotalLatency_latest vmware_vm_disk_maxTotalLatency_latest
# TYPE vmware_vm_disk_maxTotalLatency_latest gauge
vmware_vm_disk_maxTotalLatency_latest{cluster_name="",dc_name="ha-datacenter",host_name="hp",vm_name="vm1"} 0.0
# HELP vmware_host_mem_latency_average vmware_host_mem_latency_average
# TYPE vmware_host_mem_latency_average gauge
vmware_host_mem_latency_average{cluster_name="",dc_name="ha-datacenter",host_name="hp"} 0.0
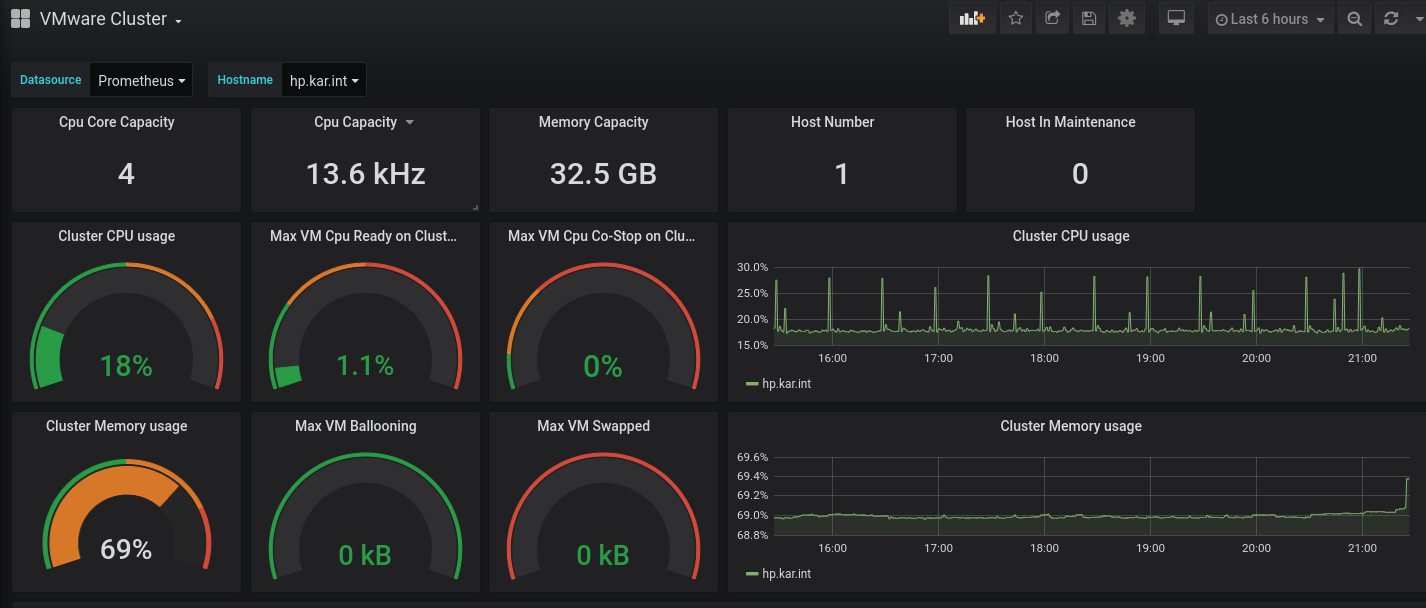
The repository also contains sample grafana dashboards and they works quite well:
I am glad to see the community embrace prometheus and provide such a variety of different ways to intergrate with it.