Grafana Dashboard for RabbitMQ
TICK setup
The setup is covered in great detail in their page. It basically breaks down into 4 parts:
| Component | Description |
|---|---|
| Telegraf | Telegraf is a plugin-driven server agent for collecting and reporting metrics. Telegraf has plugins or integrations to source a variety of metrics directly from the system it’s running on, to pull metrics from third party APIs. It also has output plugins to send metrics to a variety of other datastores, services, and message queues, including InfluxDB, Graphite, OpenTSDB, Datadog, Librato, Kafka, MQTT, NSQ, and many others. |
| InfluxDB | InfluxDB is a Time Series Database built from the ground up to handle high write & query loads. InfluxDB is a custom high performance datastore written specifically for timestamped data, including DevOps monitoring, application metrics, IoT sensor data, and real-time analytics. |
| Chronograf | Chronograf is the administrative user interface and visualization engine of the platform. It makes the monitoring and alerting for your infrastructure easy to setup and maintain. |
| Kapacitor | Kapacitor is a native data processing engine. It can process both stream and batch data from InfluxDB. |
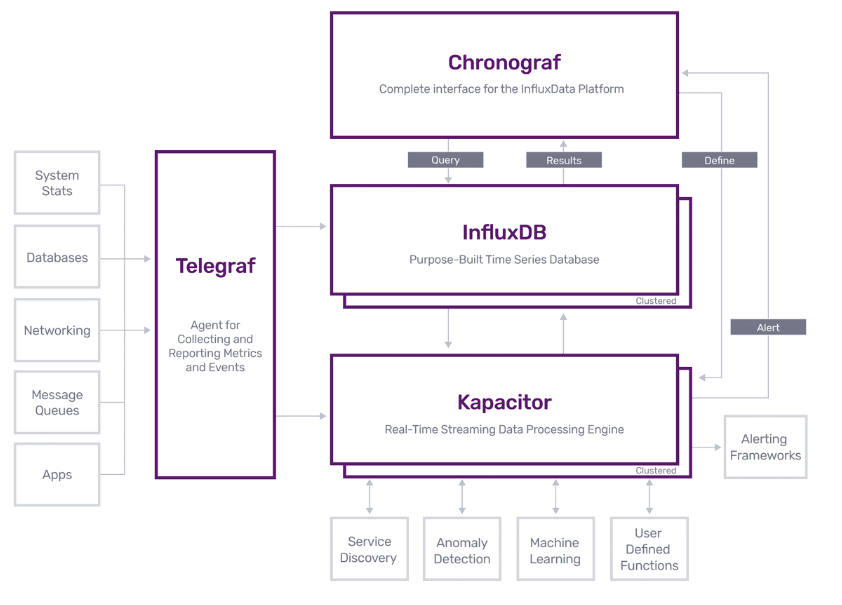
Their documentation has a pretty nice architecture diagram:
The TICK makers also provide a sample docker-compose setup for all 4 components.
Expanding the Default TICK setup
Since I wanted to try out grafana with rabbitmq, I modified the original docker-compose file to include a rabbitmq (with management enabled) container and a grafana container as well. I also enabled telegraf to connect to the rabbitmq instance (this is covered in greater detail in RabbitMQ Monitoring Integration). After starting all the containers, I saw the following:
> docker-compose up -d
Starting 13_rabbitmq_1   ... done
Starting 13_influxdb_1 ... done
Starting 13_influxdb-cli_1 ... done
Starting 13_kapacitor_1  ... done
Starting 13_telegraf_1   ... done
Starting 13_grafana_1   ... done
Starting 13_chronograf_1  ... done
Starting 13_kapacitor-cli_1 ... done
> docker-compose ps
    Name           Command        State                 Ports
------------------------------------------------------------------------------------------------------------------------------
13_chronograf_1   /entrypoint.sh chronograf    Up    0.0.0.0:8888->8888/tcp
13_grafana_1     /run.sh             Up    0.0.0.0:3000->3000/tcp
13_influxdb-cli_1  influx -host influxdb      Exit 1
13_influxdb_1    /entrypoint.sh influxd      Up    0.0.0.0:8086->8086/tcp
13_kapacitor-cli_1  bash               Exit 0
13_kapacitor_1    /entrypoint.sh kapacitord    Up    0.0.0.0:9092->9092/tcp
13_rabbitmq_1    docker-entrypoint.sh rabbi ...  Up    15671/tcp, 0.0.0.0:15672->15672/tcp, 25672/tcp, 4369/tcp,
                                5671/tcp, 0.0.0.0:5672->5672/tcp
13_telegraf_1    /entrypoint.sh telegraf     Up    0.0.0.0:8092->8092/udp, 0.0.0.0:8094->8094/tcp,
                                0.0.0.0:8125->8125/udp
The cli containers shouldn’t be running by default.
Generating Sample RabbitMQ Traffic
Following the instructions laid out at the rabbitmq site about perftools, I downloaded their app and ran it:
<> bin/runjava com.rabbitmq.perf.PerfTest -x 1 -y 2 -u "throughput-test-1" -a --id "test 1" -h amqp://localhost:5672
...
...
id: test 1, time: 681.236s, sent: 31794 msg/s, received: 24759 msg/s, min/median/75th/95th/99th latency: 2369026/2521142/2587902/2631515 µs
id: test 1, time: 682.236s, sent: 24730 msg/s, received: 26220 msg/s, min/median/75th/95th/99th latency: 2424413/2588053/2663121/2710751 µs
id: test 1, time: 683.236s, sent: 24448 msg/s, received: 27306 msg/s, min/median/75th/95th/99th latency: 2353581/2540190/2603521/2652309 µs
id: test 1, time: 684.236s, sent: 25538 msg/s, received: 24507 msg/s, min/median/75th/95th/99th latency: 2326451/2502590/2568961/2627365 µs
id: test 1, time: 685.236s, sent: 24634 msg/s, received: 23269 msg/s, min/median/75th/95th/99th latency: 2384152/2583375/2643172/2728134 µs
If you want the app to leave the created queue you can run the following:
<> ``bin/runjava com.rabbitmq.perf.PerfTest -x 1 -y 2 -u "throughput-test-10" --id "test-10" -f persistent -a -h amqp://localhost:5672 -ad false
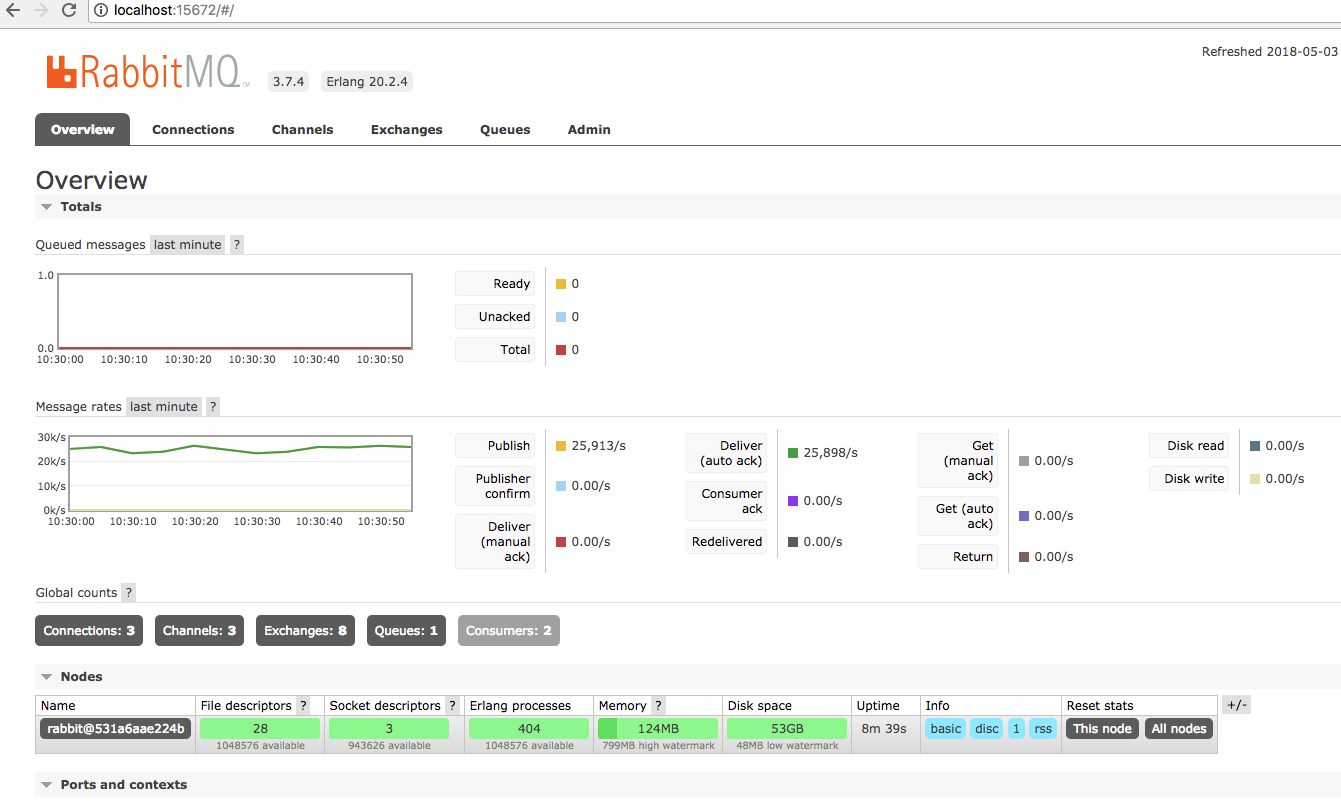
If you go to the rabbitMQ Management UI (http://localhost:15672, login with guest/guest) you will now see messages getting processed:
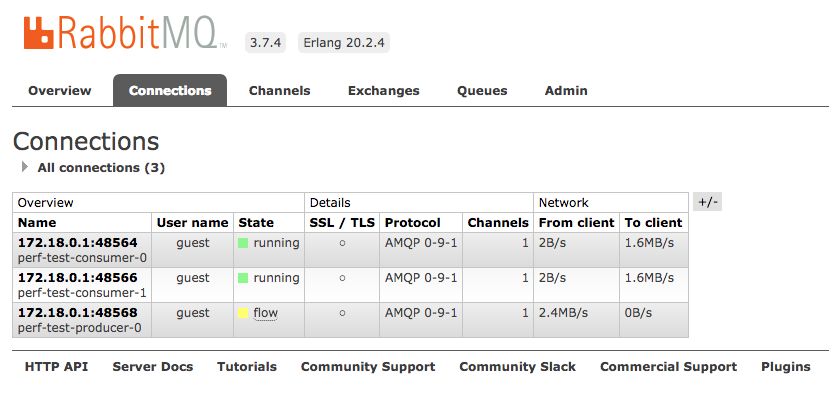
You can also checkout connections and queues:
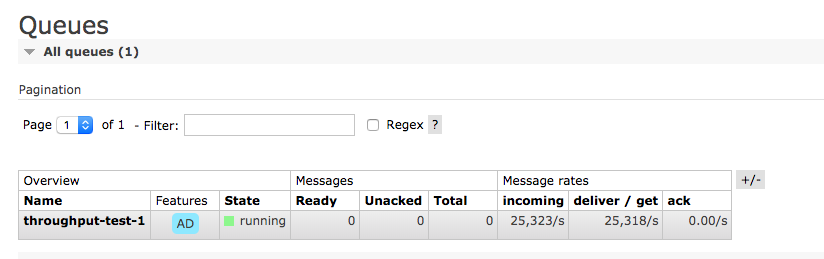
And here are the queues:
Checking out available data in InfluxDB
Now that we generated traffic we should see some data in the InfluxDB for rabbitMQ. We can use the influxdb cli for that:
> docker-compose run influxdb-cli
Starting 13_influxdb_1 ... done
Connected to http://influxdb:8086 version 1.3.5
InfluxDB shell version: 1.3.5
> show databases;
name: databases
name
----
telegraf
_internal
> use telegraf;
Using database telegraf
> show measurements;
name: measurements
name
----
cpu
disk
diskio
mem
rabbitmq_node
rabbitmq_overview
rabbitmq_queue
swap
system
> show field keys from rabbitmq_overview
name: rabbitmq_overview
fieldKey      fieldType
--------      ---------
channels      integer
connections    integer
consumers     integer
exchanges     integer
messages      integer
messages_acked   integer
messages_delivered integer
messages_published integer
messages_ready   integer
messages_unacked  integer
queues       integer
And here are the other two:
> show field keys from rabbitmq_node
name: rabbitmq_node
fieldKey    fieldType
--------    ---------
disk_free    integer
disk_free_limit integer
fd_total    integer
fd_used     integer
mem_limit    integer
mem_used    integer
proc_total   integer
proc_used    integer
run_queue    integer
sockets_total  integer
sockets_used  integer
> show field keys from rabbitmq_queue
name: rabbitmq_queue
fieldKey         fieldType
--------         ---------
consumer_utilisation   float
consumers         integer
idle_since        string
memory          integer
message_bytes       integer
message_bytes_persist   integer
message_bytes_ram     integer
message_bytes_ready    integer
message_bytes_unacked   integer
messages         integer
messages_ack       integer
messages_ack_rate     float
messages_deliver     integer
messages_deliver_get   integer
messages_deliver_get_rate float
messages_deliver_rate   float
messages_publish     integer
messages_publish_rate   float
messages_ready      integer
messages_redeliver    integer
messages_redeliver_rate  float
messages_unack      integer
If you wanted to (this might be a long list), you can also list all the series in the database:
> show series;
key
---
cpu,cpu=cpu-total,host=9458440df5b0
cpu,cpu=cpu-total,host=dca5b40f41de
cpu,cpu=cpu0,host=9458440df5b0
cpu,cpu=cpu0,host=dca5b40f41de
cpu,cpu=cpu1,host=9458440df5b0
cpu,cpu=cpu1,host=dca5b40f41de
cpu,cpu=cpu2,host=9458440df5b0
cpu,cpu=cpu2,host=dca5b40f41de
cpu,cpu=cpu3,host=9458440df5b0
cpu,cpu=cpu3,host=dca5b40f41de
disk,device=osxfs,fstype=fuse.osxfs,host=9458440df5b0,path=/etc/telegraf/telegraf.conf
disk,device=osxfs,fstype=fuse.osxfs,host=dca5b40f41de,path=/etc/telegraf/telegraf.conf
disk,device=overlay,fstype=overlay,host=9458440df5b0,path=/
disk,device=overlay,fstype=overlay,host=dca5b40f41de,path=/
disk,device=sda1,fstype=ext4,host=9458440df5b0,path=/etc/hostname
disk,device=sda1,fstype=ext4,host=9458440df5b0,path=/etc/hosts
disk,device=sda1,fstype=ext4,host=9458440df5b0,path=/etc/resolv.conf
disk,device=sda1,fstype=ext4,host=dca5b40f41de,path=/etc/hostname
disk,device=sda1,fstype=ext4,host=dca5b40f41de,path=/etc/hosts
disk,device=sda1,fstype=ext4,host=dca5b40f41de,path=/etc/resolv.conf
diskio,host=9458440df5b0,name=sda
diskio,host=9458440df5b0,name=sda1
diskio,host=9458440df5b0,name=sr0
diskio,host=9458440df5b0,name=sr1
diskio,host=dca5b40f41de,name=sda
diskio,host=dca5b40f41de,name=sda1
diskio,host=dca5b40f41de,name=sr0
diskio,host=dca5b40f41de,name=sr1
mem,host=9458440df5b0
mem,host=dca5b40f41de
rabbitmq_node,host=dca5b40f41de,node=rabbit@3eeb18c2a400,url=http://rabbitmq:15672
rabbitmq_overview,host=dca5b40f41de,url=http://rabbitmq:15672
rabbitmq_queue,auto_delete=false,durable=true,host=dca5b40f41de,node=rabbit@3eeb18c2a400,queue=test,url=http://rabbitmq:15672,vhost=/
rabbitmq_queue,auto_delete=false,durable=true,host=dca5b40f41de,node=rabbit@531a6aae224b,queue=throughput-test-10,url=http://rabbitmq:15672,vhost=/
swap,host=9458440df5b0
swap,host=dca5b40f41de
system,host=9458440df5b0
system,host=dca5b40f41de
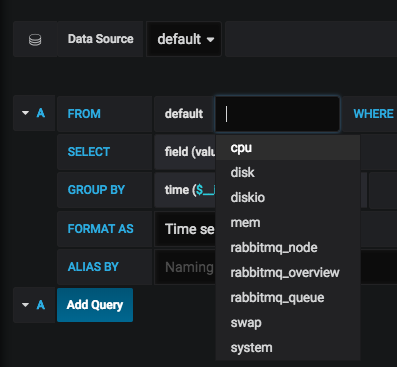
You can do a similar thing with Grafana, when you create a graph it will show you a list of available measurements:
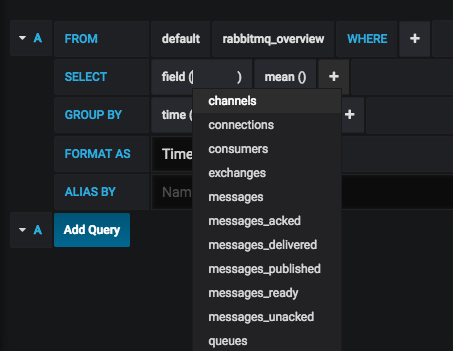
After you chose a measurement, you can get a list of available fields:
Creating a Simple Graph in Grafana from the RabbitMQ Measurements
After connecting grafana to influxdb we can now create graphs pulling from the influxdb. There are two approaches to creating the metric. One you can use the UI and just do everything from the drop down, kind of like how we saw above. Another way, we can create the query directly into the editor:
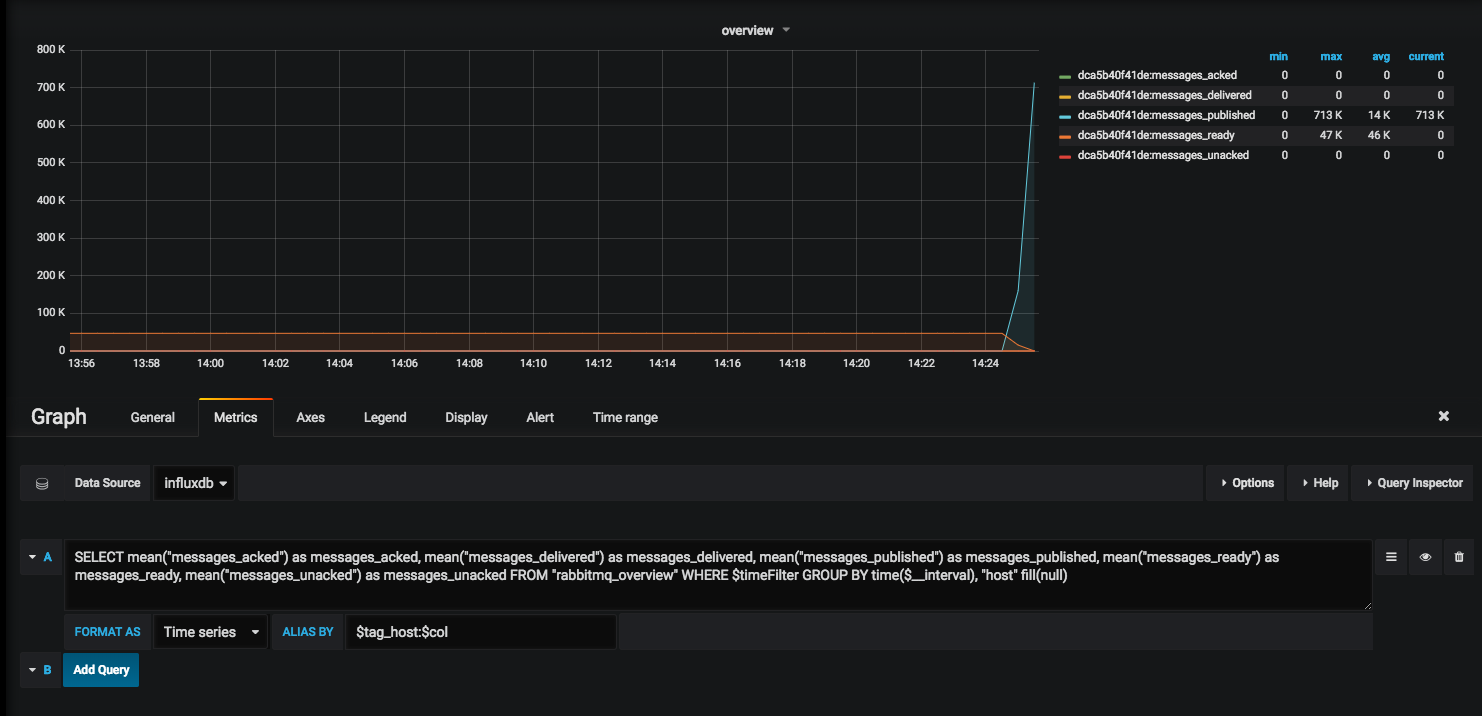
Here is the simple query that we used:
SELECT mean("messages_acked") as messages_acked, mean("messages_delivered") as messages_delivered, mean("messages_published") as messages_published, mean("messages_ready") as messages_ready, mean("messages_unacked") as messages_unacked FROM "rabbitmq_overview" WHERE $timeFilter GROUP BY time($__interval), "host" fill(null)
This basically selects certains fields and name the column the same (this way we can alias later on by it) and since we have multiple hosts we also tag by the host. We can also do something like this to create “calculations” from multiple fields:
SELECT mean(mem_used)/mean(mem_limit)*100 as mem_per FROM "rabbitmq_node" WHERE $timeFilter GROUP BY time($__interval), "host" fill(null)
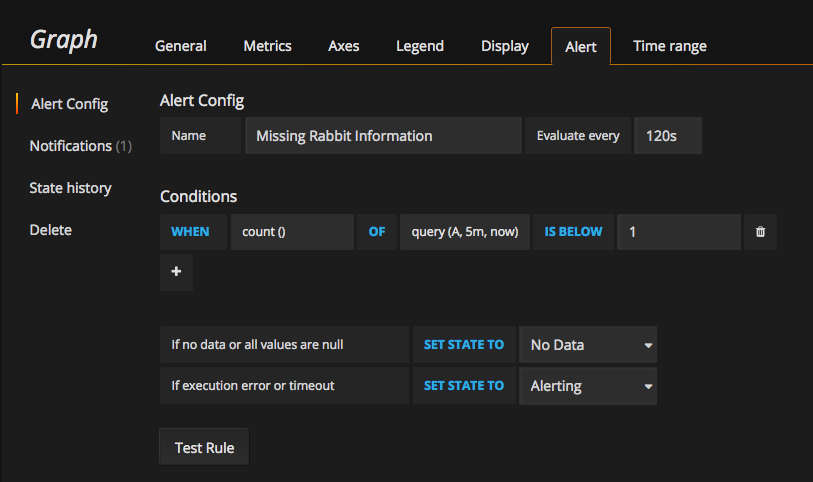
Creating a Sample Alert
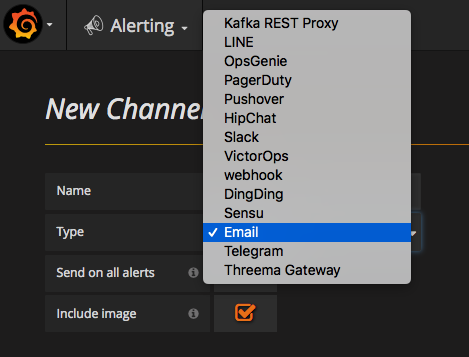
As a test I created an alert to send a slack message if the queues are less than 0, since we should never have that:
After creating the alert, you can check the State history to see if and when it has changed:

I used slack as notification medium, but grafana has a bunch by default: