Monitor ESXi S.M.A.R.T Attributes with Zabbix over SSH
From VMware KB 2040405 I saw that we can now get SMART attributes from local disks on an ESXi host. For example here is what I saw on the Mac Mini with the SSD:
~ # esxcli storage core device smart get -d t10.ATA_____APPLE_SSD_SM256E________________________S1AANYNF302924______
Parameter                     Value  Threshold  Worst
----------------------------  -----  ---------  -----
Health Status                 OK     N/A        N/A
Media Wearout Indicator       N/A    N/A        N/A
Write Error Count             N/A    N/A        N/A
Read Error Count              200    0          200
Power-on Hours                99     0          99
Power Cycle Count             99     0          99
Reallocated Sector Count      100    0          100
Raw Read Error Rate           200    0          200
Drive Temperature             60     0          42
Driver Rated Max Temperature  N/A    N/A        N/A
Write Sectors TOT Count       200    0          200
Read Sectors TOT Count        N/A    N/A        N/A
Initial Bad Block Count       N/A    N/A        N/A
Since I was already monitoring the ESXi host with Zabbix, I decided to modify the host and add an item to monitor the SSD Temperature. Most of the configuration for this is covered in Zabbix SSH checks. First let’s craft a command to only return the numeric value of the Temperature Attribute:
elatov@kerch:~$ssh root@macm esxcli storage core device smart get -d t10.ATA_____APPLE_SSD_SM256E________________________S1AANYNF302924______ | grep 'Drive Temperature' | awk '{print $3}'
60
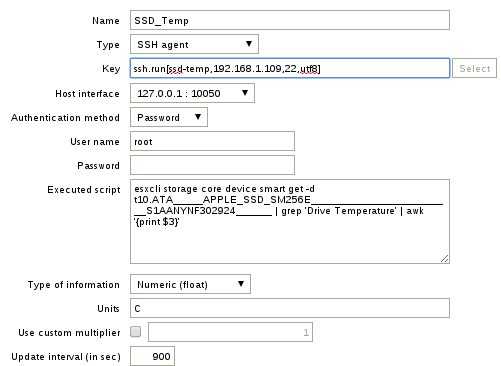
After that, we can create a new item for that host with the following configuration:

If you want you can also specify an SSH key for the connection as well, but for that to work, the zabbix user must have an existing home directory (check out Zabbix SSH checks for more information). Looking over some of the SSDs, for example from Samsung SSD 840 PRO Series Data Sheet :
Temperature Operating: 0°C to 70°C Non-Operating: -55°C to 95°C
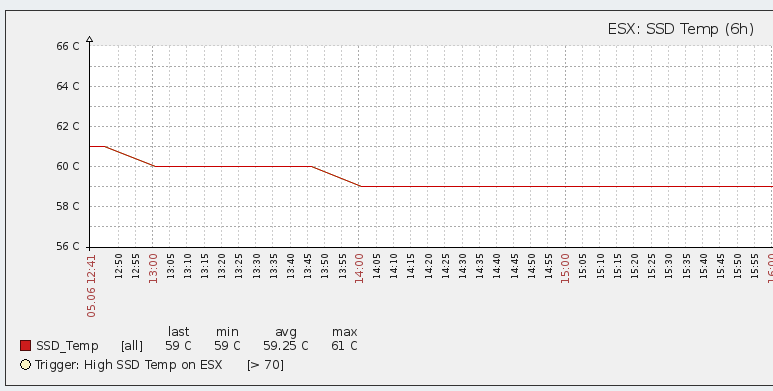
I decided to create a trigger for the temperature item to kick off if it ever reaches anything above 70:

Assigning a graph to that item and I am able to see the history of the SSD temperature:

If you want, you can obviously monitor other attributes as well.