pfSense Logging with ELK
After setting up pfsense and installing suricata on it, I decided to monitor pfsense’s logging with ELK.
Configuring LogStash
There are actually a bunch of good example out there already. Here are few:
- Monitoring pfSense (2.1 & 2.2) logs using ELK (ElasticSearch, Logstash, Kibana)
- pfsense & ELK
- pf Firewall Logs + Logstash + Elasticsearch + Kibana Install / Guide
I ended up with the following config:
┌─[elatov@puppet] - [/home/elatov] - [2016-05-08 12:57:49]
└─[0] <> cat /etc/logstash/conf.d/11-pfsense.conf
input {
  udp {
    port => 5002
    type => pfsense
  }
}
filter {
	if [host] =~ /XX\.XX\.XX\.XX/ {
	    grok {
	      match => [ "message", "<(?<evtid>.*)>(?<datetime>(?:Jan(?:uary)?|Feb(?:ruary)?|Mar(?:ch)?|Apr(?:il)?|May|Jun(?:e)?|Jul(?:y)?|Aug(?:ust)?|Sep(?:tember)?|Oct(?:ober)?|Nov(?:ember)?|Dec(?:ember)?)\s+(?:(?:0[1-9])|(?:[12][0-9])|(?:3[01])|[1-9]) (?:2[0123]|[01]?[0-9]):(?:[0-5][0-9]):(?:[0-5][0-9])) (?<prog>.*?): (?<msg>.*)" ]
	    }
	    mutate {
	      gsub => ["datetime","  "," "]
	    }
	    date {
	      match => [ "datetime", "MMM dd HH:mm:ss" ]
	    }
	    mutate {
	      replace => [ "message", "%{msg}" ]
	    }
	    mutate {
	      remove_field => [ "msg", "datetime" ]
	    }
            if [prog] =~ /^dhcpd$/ {
              mutate {
		add_tag => [ "dhcpd" ]
              }
            }
            if [prog] =~ /^suricata/ {
              mutate {
		add_tag => [ "SuricataIDPS" ]
              }
	      if [message] =~ /^\{/ {
		      mutate {
			gsub => [ "message", "[\u0000]", "\\\"}}" ]
		      }
		      json {
			source => "message"
		      }
	      }
            }
            if [prog] =~ /^charon$/ {
              mutate {
                add_tag => [ "ipsec" ]
              }
            }
            if [prog] =~ /^barnyard2/ {
              mutate {
                add_tag => [ "barnyard2" ]
              }
            }
            if [prog] =~ /^openvpn/ {
              mutate {
                add_tag => [ "openvpn" ]
              }
            }
            if [prog] =~ /^ntpd/ {
              mutate {
                add_tag => [ "ntpd" ]
              }
            }
            if [prog] =~ /^php-fpm/ {
              mutate {
                add_tag => [ "web_portal" ]
              }
              grok {
                  patterns_dir => ["/etc/logstash/conf.d/patterns"]
                  match => [ "message", "%{PFSENSE_APP} %{PFSENSE_APP_DATA}",
                  "message", "%{PFSENSE_APP} %{PFSENSE_APP_DATA}" ]
              }
              mutate {
                  lowercase => [ 'pfsense_ACTION' ]
              }
            }
            if [prog] =~ /^apinger/ {
              mutate {
                add_tag => [ "apinger" ]
              }
            }
	    if [prog] =~ /^filterlog$/ {
	        mutate {
                    remove_field => [ "msg", "datetime" ]
	        }
                grok {
                    add_tag => [ "firewall" ]
                    patterns_dir => ["/etc/logstash/conf.d/patterns"]
                    match => [ "message", "%{PFSENSE_LOG_DATA}%{PFSENSE_IP_SPECIFIC_DATA}%{PFSENSE_IP_DATA}%{PFSENSE_PROTOCOL_DATA}",
                    "message", "%{PFSENSE_LOG_DATA}%{PFSENSE_IPv4_SPECIFIC_DATA_ECN}%{PFSENSE_IP_DATA}%{PFSENSE_PROTOCOL_DATA}" ]
                }
                mutate {
                    lowercase => [ 'proto' ]
                }
		if ![geoip] and [src_ip] !~ /^(10\.|192\.168\.)/ {
                  geoip {
                    add_tag => [ "GeoIP" ]
                    source => "src_ip"
                  }
		}
            }
	}
}
I ended up adding a new type of pfsense, but other people used the below syntax to basically mark it syslog unless it’s coming from the pfsense machine. That’s probably a better setup, but since I created a dedicated port for my pfsense input I was okay with it. Here is relevant logstash config if you want to use one config:
filter {
    if [type] == "syslog" {

    #change to pfSense ip address
    if [host] =~ /10\.2\.2\.254/ {
      mutate {
        add_tag => ["PFSense", "Ready"]
      }
    }

    if "Ready" not in [tags] {
      mutate {
        add_tag => [ "syslog" ]
      }
    }
  }
}

filter {
  if [type] == "syslog" {
    mutate {
      remove_tag => "Ready"
    }
  }
}
You will notice that the above setup is pointing to a new patterns file. I ended up modifying a couple of changes in the patterns (which were “borrowed” from the above pages), just to fix some parse failures:
┌─[elatov@puppet] - [/home/elatov] - [2016-05-08 12:57:56]
└─[0] <> cat /etc/logstash/conf.d/patterns/pfsense2-2.grok
# GROK match pattern for logstash.conf filter: %{LOG_DATA}%{IP_SPECIFIC_DATA}%{IP_DATA}%{PROTOCOL_DATA}

# GROK Custom Patterns (add to patterns directory and reference in GROK filter for pfSense events):

# GROK Patterns for pfSense 2.2 Logging Format
#
# Created 27 Jan 2015 by J. Pisano (Handles TCP, UDP, and ICMP log entries)
# Edited 14 Feb 2015 by E. Paul
#
# Usage: Use with following GROK match pattern
#
# %{LOG_DATA}%{IP_SPECIFIC_DATA}%{IP_DATA}%{PROTOCOL_DATA}

PFSENSE_LOG_DATA (%{INT:rule}),(%{INT:sub_rule}),,(%{INT:tracker}),(%{WORD:iface}),(%{WORD:reason}),(%{WORD:action}),(%{WORD:direction}),(%{INT:ip_ver}),
PFSENSE_IP_SPECIFIC_DATA (%{PFSENSE_IPv4_SPECIFIC_DATA}|%{PFSENSE_IPv6_SPECIFIC_DATA})
PFSENSE_IPv4_SPECIFIC_DATA (%{BASE16NUM:tos}),,(%{INT:ttl}),(%{INT:id}),(%{INT:offset}),(%{WORD:flags}),(%{INT:proto_id}),(%{WORD:proto}),
PFSENSE_IPv4_SPECIFIC_DATA_ECN (%{BASE16NUM:tos}),(%{WORD:ecn}),(%{INT:ttl}),(%{INT:id}),(%{INT:offset}),(%{WORD:flags}),(%{INT:proto_id}),(%{WORD:proto}),
#PFSENSE_IPv4_SPECIFIC_DATA_ECN (%{BASE16NUM:tos}),(%{INT:ecn}),(%{INT:ttl}),(%{INT:id}),(%{INT:offset}),(%{WORD:flags}),(%{INT:proto_id}),(%{WORD:proto}),
PFSENSE_IPv6_SPECIFIC_DATA (%{BASE16NUM:class}),(%{DATA:flow_label}),(%{INT:hop_limit}),(%{WORD:proto}),(%{INT:proto_id}),
PFSENSE_IP_DATA (%{INT:length}),(%{IP:src_ip}),(%{IP:dest_ip}),
PFSENSE_PROTOCOL_DATA (%{PFSENSE_TCP_DATA}|%{PFSENSE_UDP_DATA}|%{PFSENSE_ICMP_DATA}|%{PFSENSE_IGMP_DATA}|%{PFSENSE_CARP_DATA})
PFSENSE_TCP_DATA (%{INT:src_port}),(%{INT:dest_port}),(%{INT:data_length}),(%{WORD:tcp_flags}),(%{INT:sequence_number}),(%{INT:ack_number}),(%{INT:tcp_window}),(%{DATA:urg_data}),(%{DATA:tcp_options})
PFSENSE_UDP_DATA (%{INT:src_port}),(%{INT:dest_port}),(%{INT:data_length})
PFSENSE_IGMP_DATA (datalength=%{INT:data_length})
PFSENSE_ICMP_DATA (%{PFSENSE_ICMP_TYPE}%{PFSENSE_ICMP_RESPONSE})
PFSENSE_ICMP_TYPE (?<icmp_type>(request|reply|unreachproto|unreachport|unreach||timexceed|timeexceed|paramprob|redirect|maskreply|needfrag|tstamp|tstampreply)),
PFSENSE_ICMP_RESPONSE (%{PFSENSE_ICMP_ECHO_REQ_REPLY}|%{PFSENSE_ICMP_UNREACHPORT}| %{PFSENSE_ICMP_UNREACHPROTO}|%{PFSENSE_ICMP_UNREACHABLE}|%{PFSENSE_ICMP_NEED_FLAG}|%{PFSENSE_ICMP_TSTAMP}|%{PFSENSE_ICMP_TSTAMP_REPLY})
PFSENSE_ICMP_ECHO_REQ_REPLY (%{INT:icmp_echo_id}),(%{INT:icmp_echo_sequence})
PFSENSE_ICMP_UNREACHPORT (%{IP:icmp_unreachport_dest_ip}),(%{WORD:icmp_unreachport_protocol}),(%{INT:icmp_unreachport_port})
PFSENSE_ICMP_UNREACHPROTO (%{IP:icmp_unreach_dest_ip}),(%{WORD:icmp_unreachproto_protocol})
PFSENSE_ICMP_UNREACHABLE (%{GREEDYDATA:icmp_unreachable})
PFSENSE_ICMP_NEED_FLAG (%{IP:icmp_need_flag_ip}),(%{INT:icmp_need_flag_mtu})
PFSENSE_ICMP_TSTAMP (%{INT:icmp_tstamp_id}),(%{INT:icmp_tstamp_sequence})
PFSENSE_ICMP_TSTAMP_REPLY (%{INT:icmp_tstamp_reply_id}),(%{INT:icmp_tstamp_reply_sequence}),(%{INT:icmp_tstamp_reply_otime}),(%{INT:icmp_tstamp_reply_rtime}),(%{INT:icmp_tstamp_reply_ttime})

PFSENSE_CARP_DATA (%{WORD:carp_type}),(%{INT:carp_ttl}),(%{INT:carp_vhid}),(%{INT:carp_version}),(%{INT:carp_advbase}),(%{INT:carp_advskew})

PFSENSE_APP (%{DATA:pfsense_APP}):
PFSENSE_APP_DATA (%{PFSENSE_APP_LOGOUT}|%{PFSENSE_APP_LOGIN}|%{PFSENSE_APP_ERROR}|%{PFSENSE_APP_GEN})
PFSENSE_APP_LOGIN (%{DATA:pfsense_ACTION}) for user \'(%{DATA:pfsense_USER})\' from: (%{GREEDYDATA:pfsense_REMOTE_IP})
PFSENSE_APP_LOGOUT User (%{DATA:pfsense_ACTION}) for user \'(%{DATA:pfsense_USER})\' from: (%{GREEDYDATA:pfsense_REMOTE_IP})
PFSENSE_APP_ERROR webConfigurator (%{DATA:pfsense_ACTION}) for \'(%{DATA:pfsense_USER})\' from (%{GREEDYDATA:pfsense_REMOTE_IP})
PFSENSE_APP_GEN (%{GREEDYDATA:pfsense_ACTION})

# DHCP

DHCPD (%{DHCPDISCOVER}|%{DHCPOFFER}|%{DHCPREQUEST}|%{DHCPACK}|%{DHCPINFORM}|%{DHCPRELEASE})

DHCPDISCOVER %{WORD:dhcp_action} from %{COMMONMAC:dhcp_client_mac}%{SPACE}(\(%{GREEDYDATA:dhcp_client_hostname}\))? via (?<dhcp_client_vlan>[0-9a-z_]*)(: %{GREEDYDATA:dhcp_load_balance})?

DHCPOFFER %{WORD:dhcp_action} on %{IPV4:dhcp_client_ip} to %{COMMONMAC:dhcp_client_mac}%{SPACE}(\(%{GREEDYDATA:dhcp_client_hostname}\))? via (?<dhcp_client_vlan>[0-9a-z_]*)

DHCPREQUEST %{WORD:dhcp_action} for %{IPV4:dhcp_client_ip}%{SPACE}(\(%{IPV4:dhcp_ip_unknown}\))? from %{COMMONMAC:dhcp_client_mac}%{SPACE}(\(%{GREEDYDATA:dhcp_client_hostname}\))? via (?<dhcp_client_vlan>[0-9a-z_]*)(: %{GREEDYDATA:dhcp_request_message})?

DHCPACK %{WORD:dhcp_action} on %{IPV4:dhcp_client_ip} to %{COMMONMAC:dhcp_client_mac}%{SPACE}(\(%{GREEDYDATA:dhcp_client_hostname}\))? via (?<dhcp_client_vlan>[0-9a-z_]*)

DHCPINFORM %{WORD:dhcp_action} from %{IPV4:dhcp_client_ip} via %(?<dhcp_client_vlan>[0-9a-z_]*)

DHCPRELEASE %{WORD:dhcp_action} of %{IPV4:dhcp_client_ip} from %{COMMONMAC:dhcp_client_mac}%{SPACE}(\(%{GREEDYDATA:dhcp_client_hostname}\))? via (?<dhcp_client_vlan>[0-9a-z_]*) %{GREEDYDATA:dhcp_release_message}
I ran into issues parsing the ECN option, in my setup it was coming in as string and not an integer. From the wikipedia page here are the conversions:
- 00 – Non ECN-Capable Transport, Non-ECT
- 10 – ECN Capable Transport, ECT(0)
- 01 – ECN Capable Transport, ECT(1)
- 11 – Congestion Encountered, CE.
I was seeing CE instead of 11 (not sure if was due to the fact that I was on pfsense 2.3 vs 2.2). I also added a catch all for the PFSENSE_APP section since some of the logs were failing to get parsed.
Suricata Logs
I ended up sending the JSON EVE logs over syslog just to make sure I didn’t have much customization of the pfsense machine. I think the setup using filebeat is better, but this worked out as well. Some of the JSON was getting truncated and there was a null character (/u0000) at the end of the message. You can see above in the setup, I check if JSON is in the message then replace the null character with a curly bracket (}). This fixed most of the truncated messages, but not all. I am still contemplating whether I should install filebeat on the pfsense machine. BTW just for reference I have the following configured on my logstash setup to check out any failed messages:
output {
  if "_grokparsefailure" in [tags] {
    file { path => "/var/log/logstash/failed_syslog_events-%{+YYYY-MM-dd}" }
  }
  if "_jsonparsefailure" in [tags] {
    file { path => "/var/log/logstash/failed_json_events-%{+YYYY-MM-dd}" }
  }
  elasticsearch { hosts => ["localhost:9200"] }
  stdout { codec => rubydebug }
}
Apply the LogStash Config
Before enabling the above config make sure it’s good:
┌─[elatov@puppet] - [/etc/logstash/conf.d] - [2016-05-07 12:17:36]
└─[0] <> sudo service logstash configtest
Configuration OK
And if it’s all good restart the service:
sudo service logstash restart
And make sure you don’t see anything bad in /var/log/logstash/logstash.log and to make sure it’s working check out /var/log/logstash/logstash.stdout for some parsed events:
Here is a firewall message:
{
        "message" => "5,16777216,,1000000103,re0,match,block,in,4,0x20,,110,24277,0,none,17,udp,131,128.204.35.107,XX.XX.XX.XX,17656,22986,111",
       "@version" => "1",
     "@timestamp" => "2016-05-08T19:21:13.000Z",
           "type" => "pfsense",
           "host" => "192.168.1.99",
          "evtid" => "134",
           "prog" => "filterlog",
           "rule" => "5",
       "sub_rule" => "16777216",
        "tracker" => "1000000103",
          "iface" => "re0",
         "reason" => "match",
         "action" => "block",
      "direction" => "in",
         "ip_ver" => "4",
            "tos" => "0x20",
            "ttl" => "110",
             "id" => "24277",
         "offset" => "0",
          "flags" => "none",
       "proto_id" => "17",
          "proto" => "udp",
         "length" => "131",
         "src_ip" => "128.204.35.107",
        "dest_ip" => "XX.XX.XX.XX",
       "src_port" => "17656",
      "dest_port" => "22986",
    "data_length" => "111",
           "tags" => [
        [0] "firewall",
        [1] "GeoIP"
    ],
          "geoip" => {
                    "ip" => "128.204.35.107",
         "country_code2" => "RU",
         "country_code3" => "RUS",
          "country_name" => "Russian Federation",
        "continent_code" => "EU",
              "latitude" => 60.0,
             "longitude" => 100.0,
              "location" => [
            [0] 100.0,
            [1] 60.0
        ]
    }
}
And here is Suricata JSON Message:
{
       "message" => "{\"timestamp\":\"2016-05-08T13:16:05.413174-0600\",\"flow_id\":35095115264,\"in_iface\":\"re0\",\"event_type\":\"http\",\"src_ip\":\"XX.XX.XX.XX\",\"src_port\":59355,\"dest_ip\":\"23.3.12.88\",\"dest_port\":80,\"proto\":\"TCP\",\"tx_id\":0,\"http\":{\"hostname\":\"init-p01st.push.apple.com\",\"url\":\"\\/bag\",\"http_user_agent\":\"iPad3,1\\/9.3.1 (13E238)\",\"http_content_type\":\"application\\/x-apple-plist\"}}",
      "@version" => "1",
    "@timestamp" => "2016-05-08T19:16:05.413Z",
          "type" => "pfsense",
          "host" => "192.168.1.99",
         "evtid" => "142",
          "prog" => "suricata[4719]",
          "tags" => [
        [0] "SuricataIDPS"
    ],
     "timestamp" => "2016-05-08T13:16:05.413174-0600",
       "flow_id" => 35095115264,
      "in_iface" => "re0",
    "event_type" => "http",
        "src_ip" => "XX.XX.XX.XX",
      "src_port" => 59355,
       "dest_ip" => "23.3.12.88",
     "dest_port" => 80,
         "proto" => "TCP",
         "tx_id" => 0,
          "http" => {
                 "hostname" => "init-p01st.push.apple.com",
                      "url" => "/bag",
          "http_user_agent" => "iPad3,1/9.3.1 (13E238)",
        "http_content_type" => "application/x-apple-plist"
    }
}
Not too shabby.
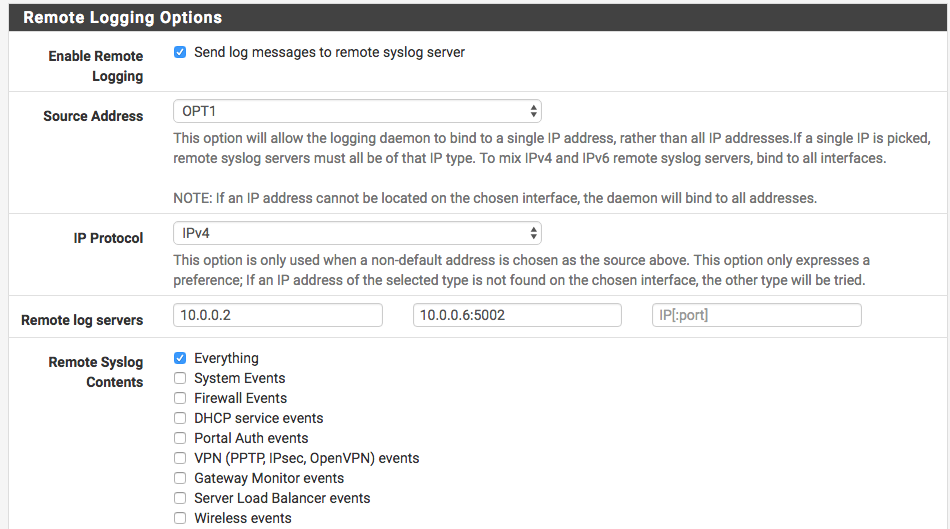
pfSense Enable Remote Syslog
On the pfSense side I just went to Status -> System Logs -> Settings and enabled the remote logging:
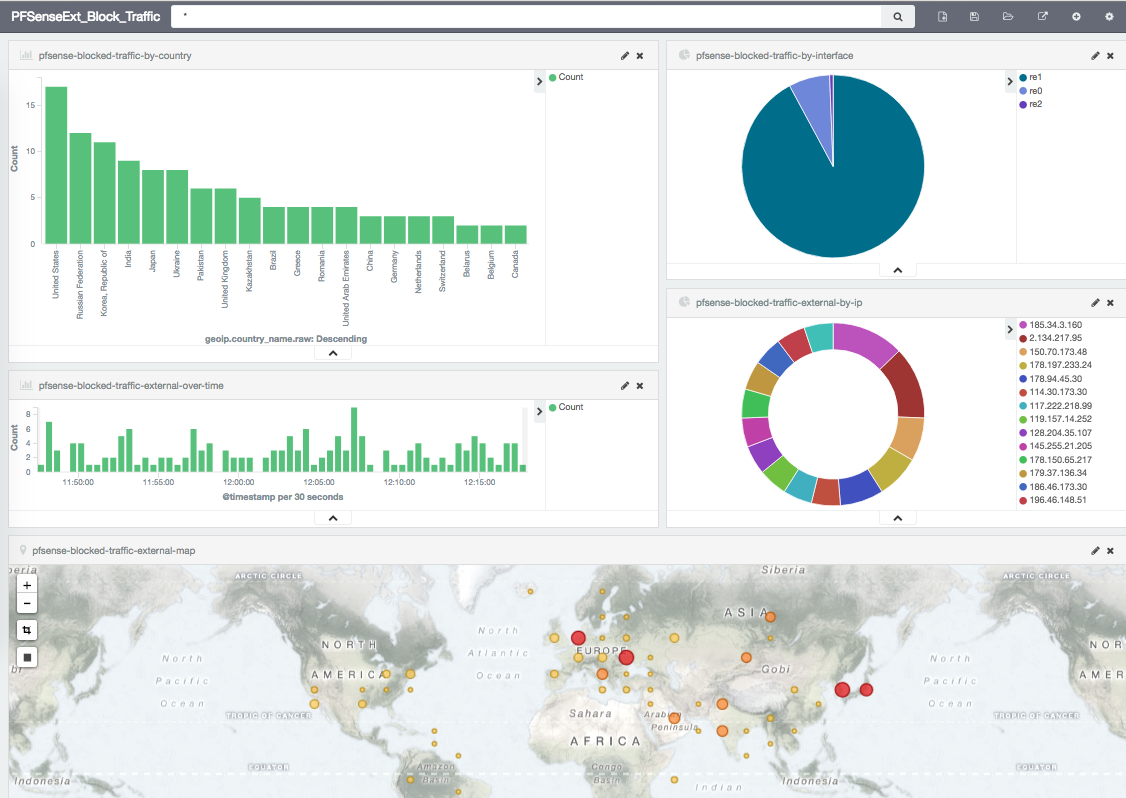
Kibana Dashboard
The above sites have a bunch of examples. After some time playing around with different options I ended up with this one: