Installing Splunk Forwarder on pfSense
I wanted to ship my suricata alerts to my splunk instance. You could probably use syslog but the json won’t show up nicely in splunk: Consuming JSON With Splunk In Two Simple Steps, Is it possible to parse an extracted field as json if the whole log line isn’t json?, and Sending rsyslog JSON format. There are a couple of work arounds but they are kind of painful. I heard of the Splunk forwarder and I wanted to try it out, so I decided to go that route.
Download the SplunkForwader
After logging into the splunk site you can get the wget command for the download:
<> wget -O splunkforwarder-6.4.2-00f5bb3fa822-freebsd-10.1-amd64.txz 'https://www.splunk.com/bin/splunk/DownloadActivityServlet?architecture=x86_64&platform=freebsd&version=6.4.2&product=universalforwarder&filename=splunkforwarder-6.4.2-00f5bb3fa822-freebsd-10.1-amd64.txz&wget=true'
Then we can just scp it to the pfSense machine:
┌─[elatov@kerch] - [/home/elatov] - [2016-08-02 10:57:12]
└─[0] <> scp splunkforwarder-6.4.2-00f5bb3fa822-freebsd-10.1-amd64.txz pfl:
root@pfl.kar.int's password:
splunkforwarder-6.4.2-00f5bb3fa822-freebsd-10 100%   12MB  12.2MB/s   00:01
Install the SplunkForwarder
Now let’s go ahead and extract the software. First ssh to the pfSense machine and then run the following:
[2.3.2-RELEASE][root@pf.kar.int]/root: tar xJfP splunkforwarder-6.4.2-00f5bb3fa822-freebsd-10.1-amd64.txz
The install instructions are covered here.
Configure SplunkForwarder
Next let’s create a configuration to define where to forward the data to, which will be our splunk server. This is done by creating the outputs.conf file. Here are the basic configuration settings that go into that file. I ended up creating the following:
[2.3.2-RELEASE][root@pf.kar.int]/root: cat /opt/splunkforwarder/etc/system/local/outputs.conf
[tcpout]
defaultGroup=my_indexers

[tcpout:my_indexers]
server=10.0.0.2:9997
Next let’s configure what we are going to send. I was just planning on sending the suricata alerts, which are in a json file here:
[2.3.2-RELEASE][root@pf.kar.int]/root: ls -l /var/log/suricata/suricata_re034499/eve.json
-rw-r-----  1 root  wheel  27974 Aug  2 11:43 /var/log/suricata/suricata_re034499/eve.json
So here is the inputs.conf file I ended up with:
[2.3.2-RELEASE][root@pf.kar.int]/root: cat /opt/splunkforwarder/etc/system/local/inputs.conf
[monitor:///var/log/suricata/suricata_re034499/eve.json]
sourcetype=suricata
Examples for the inputs.conf are here.
Configure Splunk Server/Indexer to Accept Data From Splunk Forwarder
Then on the indexer, I created a sourcetype (This is covered in here and here):
root@kerch:~# tail -6 /opt/splunk/etc/system/local/inputs.conf
[splunktcp://192.168.1.99:9997]
disabled = false
sourcetype = suricata
connection_host = none
compressed = true
And then I marked it as json with props.conf:
root@kerch:~# cat /opt/splunk/etc/system/local/props.conf
[suricata]
KV_MODE = json
NO_BINARY_CHECK = 1
TRUNCATE = 0
On the indexer, I restarted the splunk service:
root@kerch:~# systemctl restart splunk
And confirmed I was now listening on port 9997 tcp:
┌─[elatov@kerch] - [/home/elatov] - [2016-08-03 04:19:26]
└─[0] <> sudo /opt/splunk/bin/splunk list inputstatus -input 9997
Cooked:tcp :
        9997:192.168.1.99:8089
                time opened = 2016-08-03T11:10:28-0600

tcp_cooked:listenerports :
        9997
Don’t forget your firewall:
root@kerch:~# sudo iptables -L -n -v | grep 9997
    0     0 ACCEPT     tcp  --  *      *       192.168.1.0/24       0.0.0.0/0            state NEW tcp dpt:9997
Last test you can do is a telnet from the pfSense to the splunk indexer:
[2.3.2-RELEASE][root@pf.kar.int]/root: telnet 10.0.0.2 9997
Trying 10.0.0.2...
Connected to kerch.kar.int.
Escape character is '^]'.
Confirm Data is Sent From Forwarder
Now let’s start the forwarder:
[2.3.2-RELEASE][root@pf.kar.int]/root: /opt/splunkforwarder/bin/splunk start
                    SOFTWARE LICENSE AGREEMENT

Do you agree with this license? [y/n]: y

This appears to be your first time running this version of Splunk.

Splunk> Finding your faults, just like mom.

Checking prerequisites...
        Checking mgmt port [8089]: open
                Creating: /opt/splunkforwarder/var/lib/splunk
                Creating: /opt/splunkforwarder/var/run/splunk
                Creating: /opt/splunkforwarder/var/run/splunk/appserver/i18n
                Creating: /opt/splunkforwarder/var/run/splunk/appserver/modules/static/css
                Creating: /opt/splunkforwarder/var/run/splunk/upload
                Creating: /opt/splunkforwarder/var/spool/splunk
                Creating: /opt/splunkforwarder/var/spool/dirmoncache
                Creating: /opt/splunkforwarder/var/lib/splunk/authDb
                Creating: /opt/splunkforwarder/var/lib/splunk/hashDb
New certs have been generated in '/opt/splunkforwarder/etc/auth'.
        Checking conf files for problems...
        Done
        Checking default conf files for edits...
        Validating installed files against hashes from '/opt/splunkforwarder/splunkforwarder-6.4.2-00f5bb3fa822-FreeBSD9-amd64-manifest'
        All installed files intact.
        Done
All preliminary checks passed.

Starting splunk server daemon (splunkd)...
Generating a 1024 bit RSA private key
.......++++++
..........++++++
writing new private key to 'privKeySecure.pem'
-----
Signature ok
subject=/CN=pf.kar.int/O=SplunkUser
Getting CA Private Key
writing RSA key
Done
Let’s confirm it’s running:
[2.3.2-RELEASE][root@pf.kar.int]/root: /opt/splunkforwarder/bin/splunk status
splunkd is running (PID: 14737).
splunk helpers are running (PIDs: 14995).
If all is well you should see the following in the logs:
[2.3.2-RELEASE][root@pf.kar.int]/root: tail -f /opt/splunkforwarder/var/log/splunk/splunkd.log
08-02-2016 12:47:52.226 -0600 WARN  TcpOutputProc - Forwarding to indexer group my_indexers blocked for 1200 seconds.
08-02-2016 12:48:07.049 -0600 INFO  TcpOutputProc - Connected to idx=10.0.0.2:9997
08-02-2016 12:48:07.129 -0600 INFO  TailReader -   ...continuing.
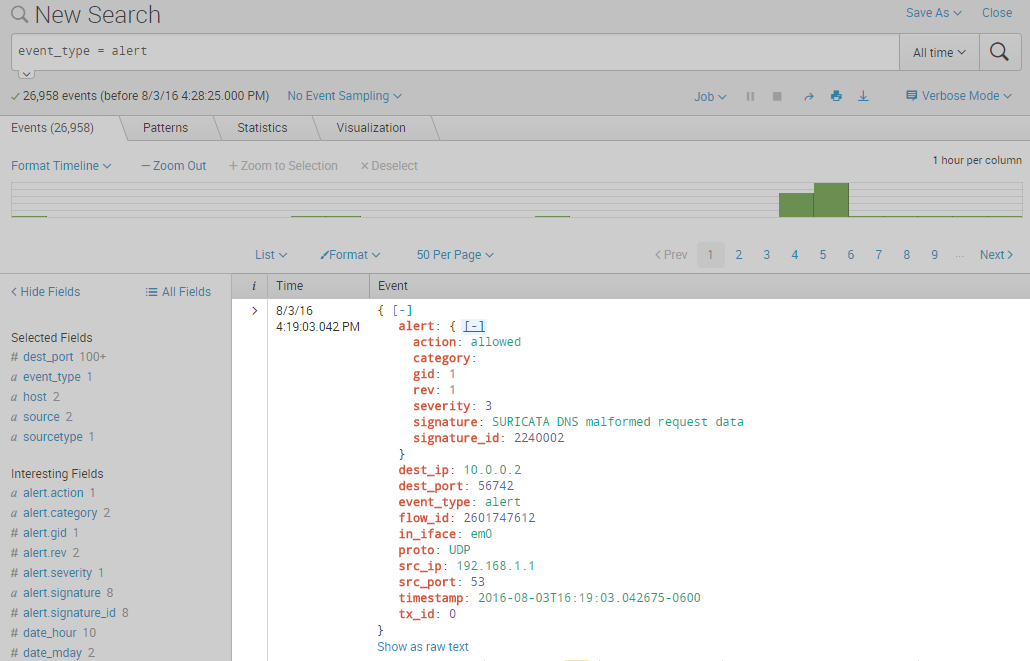
And of course if you check out the splunk UI you will see the json alerts in there:
Enable Auto Start of Splunk Forwarder
if you were on another FreeBSD system you can enable it to start on boot with the following command:
┌─[elatov@moxz] - [/home/elatov] - [2016-08-03 10:35:40]
└─[0] <> sudo /opt/splunkforwarder/bin/splunk enable boot-start

Init script installed at /etc/rc.d/splunk.
Init script is configured to run at boot.
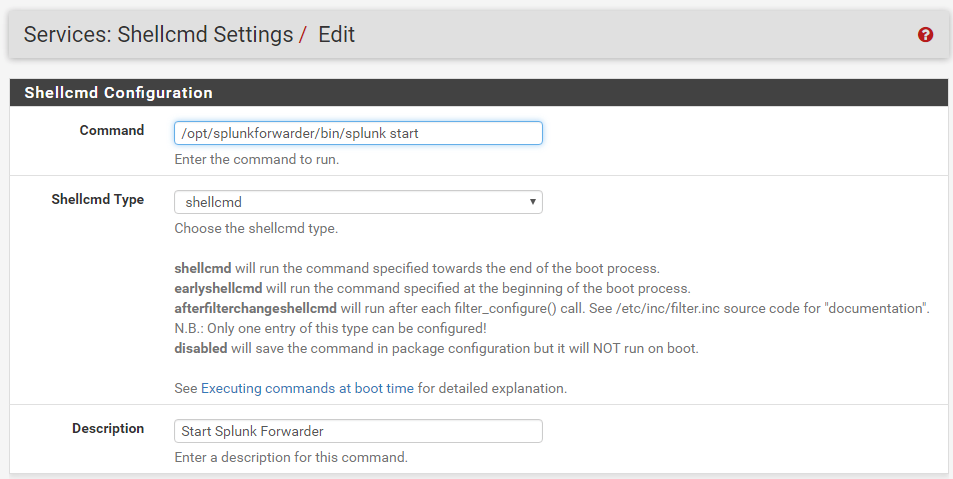
But with pfSense we can add the start command as a shellcmd, the process is covered here, here is what I added: