Run Elasticsearch and Kibana on Docker
Elasticsearch with Docker
I had a CoreOS machine and I wanted to move my ELK (elasticsearch,logstash, and kibana) stack to docker. At first I wanted to move all the machines, but then I realized that I was already using UDP port 514 for splunk on the same host so I decided to just move just the elasticsearch and kibana components. This was actually perfect, cause all the components were on the same machine before and were using localhost for communication and I wanted to see how the remote communication works out between some of the components.
CoreOS sysctl configuration
Looking over the Install Elasticsearch with Docker, it looks like they recommend modifying the following sysctl/kernel parameter:
The vm_max_map_count kernel setting needs to be set to at least 262144 for production use. Depending on your platform:
Linux
The vm_map_max_count setting should be set permanently in /etc/sysctl.conf:
  $ grep vm.max_map_count /etc/sysctl.conf
  vm.max_map_count=262144
To apply the setting on a live system type:
sysctl -w vm.max_map_count=262144
With CoreOS we can follow the instructions laid out in Tuning sysctl parameters. I basically added the following section to my config:
write_files:
  - path: /etc/sysctl.d/elk.conf
    content: |
      vm.max_map_count=262144
Then ran the following to apply it to the configuration (now if the host reboots that setting will be there):
core ~ # coreos-cloudinit -validate --from-file cloud-config.yaml
2017/03/15 13:38:03 Checking availability of "local-file"
2017/03/15 13:38:03 Fetching user-data from datasource of type "local-file"
core ~ # coreos-cloudinit --from-file cloud-config.yaml
..
2017/03/15 13:38:14 Writing file to "/etc/sysctl.d/elk.conf"
2017/03/15 13:38:14 Wrote file to "/etc/sysctl.d/elk.conf"
2017/03/15 13:38:14 Wrote file /etc/sysctl.d/elk.conf to filesystem
core ~ # cp cloud-config.yaml /var/lib/coreos-install/user_data
And finally ran the following to do it on the fly so I can keep proceeding with the setup:
core ~ # sysctl -w vm.max_map_count=262144
core ~ # sysctl vm.max_map_count
vm.max_map_count = 262144
Creating docker-compose config file
There is actually a pretty good example of the compose file for elasticsearch from the main page here. And the Configuring Kibana on Docker page has a good example of the docker-compose section for the kibana service. So I ended up creating the following file:
core elk # cat docker-compose.yml
version: '2'
services:

  elasticsearch:
    image: "docker.elastic.co/elasticsearch/elasticsearch:5.2.2"
    hostname: elasticsearch
    ports:
      - "9200:9200"
      - "9300:9300"
    volumes:
      - "./es/data:/usr/share/elasticsearch/data"
      - "./es/config/elasticsearch.yml:/usr/share/elasticsearch/config/elasticsearch.yml"
    ulimits:
      memlock:
        soft: -1
        hard: -1
      nofile:
        soft: 65536
        hard: 65536

  kibana:
    image: "docker.elastic.co/kibana/kibana:5.2.2"
    hostname: kibana
    links:
      - elasticsearch
    ports:
      - "5601:5601"
    volumes:
      - "./kibana/config/kibana.yml:/usr/share/kibana/config/kibana.yml"
Preparing Local Volumes
Since I wanted to change some settings (and keep the elasticsearch data persistent), I ended up with the following directory structure:
core elk # find . -maxdepth 3
.
./docker-compose.yml
./es
./es/config
./es/config/elasticsearch.yml
./es/data
./kibana
./kibana/config
./kibana/config/kibana.yml
And you can see in the docker-compose.yml file I am mounting those files into the containers. One more important thing is to chown the files to UID 1000, this is necessary since when the daemons start inside the containers they run as UID 1000 and need access to those directories/files:
core elk # chown 1000:1000 -R es kibana
There is a note about that in the main documentation: Configuring Elasticsearch with Docker:
custom_elasticsearch.yml should be readable by uid:gid 1000:1000
Configuration Files for Elasticsearch and Kibana
By default x-pack is installed the docker images provided by elastic.co, so I just disabled those features in the configuration. Here are the configs that I ended up with:
core elk # grep -vE '^$|^#' es/config/elasticsearch.yml
network.host: 0.0.0.0
xpack.security.enabled: false
xpack.monitoring.enabled: false
xpack.watcher.enabled: false
xpack.graph.enabled: false
And here is the kibana config:
core elk # grep -vE '^$|^#' kibana/config/kibana.yml
server.host: "0.0.0.0"
elasticsearch.url: "http://elasticsearch:9200"
elasticsearch.requestTimeout: 500000
xpack.security.enabled: false
xpack.monitoring.enabled: false
xpack.graph.enabled: false
xpack.reporting.enabled: false
I could probably pass those into the command or set environment variables, but I decided to use config files.
Send Logs from Logstash
As I mentioned I just kept the original logstash service, so I modified the config to now forward logs to the new elasticsearch instance:
<> tail -3 /etc/logstash/conf.d/logstash-syslog.conf
output {
  elasticsearch { hosts => ["http://core.kar.int:9200"] }
}
Then I ran the following to make sure the configuration is okay:
<> sudo /usr/share/logstash/bin/logstash --config.test_and_exit --path.settings=/etc/logstash/ -f /etc/logstash/conf.d/logstash-syslog.conf
And then finally the following to restart the service:
<> sudo systemctl restart logstash
Logstash Docker Compose
BTW if you wanted to you could use a similar configuration for the logstash docker-compose configuration:
logstash:
    image: "docker.elastic.co/logstash/logstash:5.2.2"
    hostname: logstash
    command: /usr/share/logstash/bin/logstash -f /usr/share/logstash/config/conf.d/logstash-syslog.conf
    links:
      - elasticsearch
    ports:
      - "514:514/udp"
    volumes:
      - "./logstash/config/logstash.yml:/usr/share/logstash/config/logstash.yml"
      - "./logstash/config/conf.d:/usr/share/logstash/config/conf.d"
      - "./logstash/log/:/var/log/logstash"
We are overriding the command since that will allow the process to start as root and to bind the service to UDP port 514. This is discussed in cannot start syslog listener.
Testing out the Config
After that’s all set, we can just run the following to start both of the containers:
core elk # docker-compose up -d
And to confirm everything is okay, check out the logs:
core elk # docker-compose logs kibana
kibana_1         | {"type":"log","@timestamp":"2017-03-15T05:20:12Z","tags":["status","plugin:timelion@5.2.2","info"],"pid":7,"state":"green","message":"Status changed from uninitialized to green - Ready","prevState"	:"uninitialized","prevMsg":"uninitialized"}
kibana_1         | {"type":"log","@timestamp":"2017-03-15T05:20:12Z","tags":["listening","info"],"pid":7,"message":"Server running at http://0.0.0.0:5601"}
kibana_1         | {"type":"log","@timestamp":"2017-03-15T05:20:12Z","tags":["status","ui settings","info"],	"pid":7,"state":"green","message":"Status changed from uninitialized to green - Ready","prevState":"uninitialized","prevMsg":"uninitialized"}

core elk # docker-compose logs elasticsearch
elasticsearch_1  | [2017-03-15T05:19:57,833][INFO ][o.e.t.TransportService   ] [BQ5wsz8] publish_address {172.21.0.2:9300}, bound_addresses {[::]:9300}
elasticsearch_1  | [2017-03-15T05:19:57,855][INFO ][o.e.b.BootstrapChecks    ] [BQ5wsz8] bound or publishing to a non-loopback or non-link-local address, enforcing bootstrap checks
elasticsearch_1  | [2017-03-15T05:20:00,982][INFO ][o.e.c.s.ClusterService   ] [BQ5wsz8] new_master {BQ5wsz8}{BQ5wsz8aTXageC3pwoGqEQ}{Q9hDrZk2TkqjNDgduciVIA}{172.21.0.2}{172.21.0.2:9300}, reason: zen-disco-elected-as-master ([0] nodes joined)
elasticsearch_1  | [2017-03-15T05:20:01,016][INFO ][o.e.h.HttpServer         ] [BQ5wsz8] publish_address {172.21.0.2:9200}, bound_addresses {[::]:9200}
elasticsearch_1  | [2017-03-15T05:20:01,017][INFO ][o.e.n.Node               ] [BQ5wsz8] started
If you want you can also check out the logs are the containers come up:
core elk # docker-compose logs -f
Exporting the Visualizations
I logged into the original kibana instance and went to Management -> Saved Objects -> Export Everything. And that created an export.json file. Initially when I went to the new kibana instance and imported the file (Management -> Saved Objects -> Import), I saw the following error:
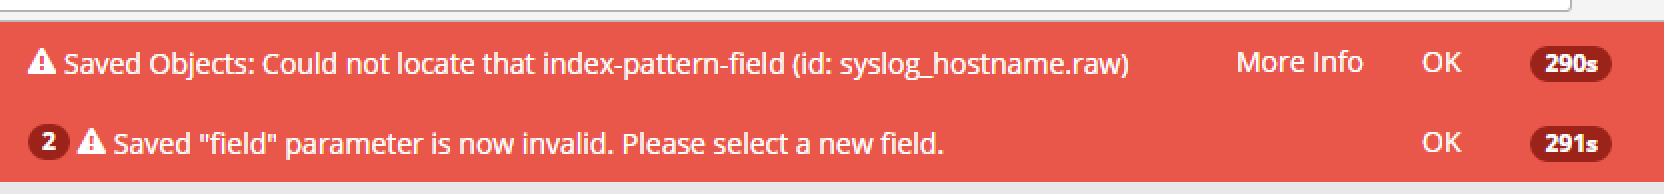
It looks like this was a known issue (Kibana .raw in 5.0.0 alpha3) for Kibana 5.0. Since I had old mappings from the 4.x versions they were called .raw and I needed to change them to .keyword. So I ran this on the file:
<> gsed -i 's/raw/keyword/' export.json
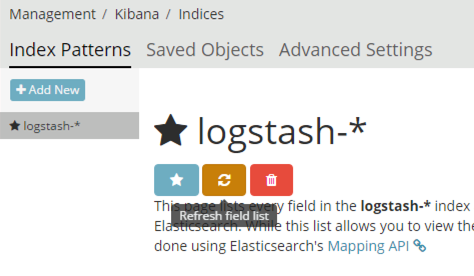
And then the re-import worked without issues. Don’t forget to refresh your field list (Management -> Index Patterns -> Logstash-* -> Refresh field list) after some data comes in from logstash: