Installing Heapster for Kubernetes
Heapster
Heapster monitors the kubernetes cluster, more information on it is available here.
Deploy Heapster
There are some good example of the deployment here:
- How to Utilize the “Heapster + InfluxDB + Grafana” Stack in Kubernetes for Monitoring Pods
- Run Heapster in a Kubernetes cluster with an InfluxDB backend and a Grafana UI
First let’s clone their repo:
git clone https://github.com/kubernetes/heapster.git
Next, modify the files to use a NodePort:
# heapster/deploy/kube-config/influxdb/grafana.yaml
type: NodePort
  ports:
  - port: 80
    targetPort: 3000
    nodePort: 30081
Also add local volumes:
# heapster/deploy/kube-config/influxdb/grafana.yaml
- name: grafana-storage
        hostPath:
          path: /data/shared/heapster/grafana/data
and
# heapster/deploy/kube-config/influxdb/influxdb.yaml
- name: influxdb-storage
        hostPath:
          path: /data/shared/heapster/influxdb/data
Then deploy the pod:
<> kubectl apply -f .
deployment "monitoring-grafana" created
service "monitoring-grafana" created
serviceaccount "heapster" created
deployment "heapster" created
service "heapster" created
deployment "monitoring-influxdb" created
service "monitoring-influxdb" created
Fix Permission issue
At first had permission errors:
<> kubectl logs --namespace=kube-system po/heapster-5d67855584-zq8k5
I1125 18:33:23.332631       1 heapster.go:72] /heapster --source=kubernetes:https://kubernetes.default --sink=influxdb:http://monitoring-influxdb.kube-system.svc:8086
I1125 18:33:23.332676       1 heapster.go:73] Heapster version v1.4.0
I1125 18:33:23.332869       1 configs.go:61] Using Kubernetes client with master "https://kubernetes.default" and version v1
I1125 18:33:23.332884       1 configs.go:62] Using kubelet port 10255
E1125 18:33:23.342896       1 kubelet.go:334] Failed to load nodes: nodes is forbidden: User "system:serviceaccount:kube-system:heapster" cannot list nodes at the cluster scope
E1125 18:33:23.343800       1 reflector.go:190] k8s.io/heapster/metrics/util/util.go:51: Failed to list *v1.Node: nodes is forbidden: User "system:serviceaccount:kube-system:heapster" cannot list nodes at the cluster scope
E1125 18:33:23.388293       1 influxdb.go:264] issues while creating an InfluxDB sink: failed to ping InfluxDB server at "monitoring-influxdb.kube-system.svc:8086" - Get http://monitoring-influxdb.kube-system.svc:8086/ping: dial tcp: lookup monitoring-influxdb.kube-system.svc on 10.96.0.10:53: no such host, will retry on use
I1125 18:33:23.388332       1 influxdb.go:278] created influxdb sink with options: host:monitoring-influxdb.kube-system.svc:8086 user:root db:k8s
I1125 18:33:23.388368       1 heapster.go:196] Starting with InfluxDB Sink
I1125 18:33:23.388376       1 heapster.go:196] Starting with Metric Sink
E1125 18:33:23.390558       1 reflector.go:190] k8s.io/heapster/metrics/util/util.go:51: Failed to list *v1.Node: nodes is forbidden: User "system:serviceaccount:kube-system:heapster" cannot list nodes at the cluster scope
The permission issue is mentioned at the readme, and we need to create the RBAC role:
cd heapster/deploy/kube-config/rbac/
Then just create it:
<> kubectl apply -f heapster-rbac.yaml
clusterrolebinding "heapster" configured
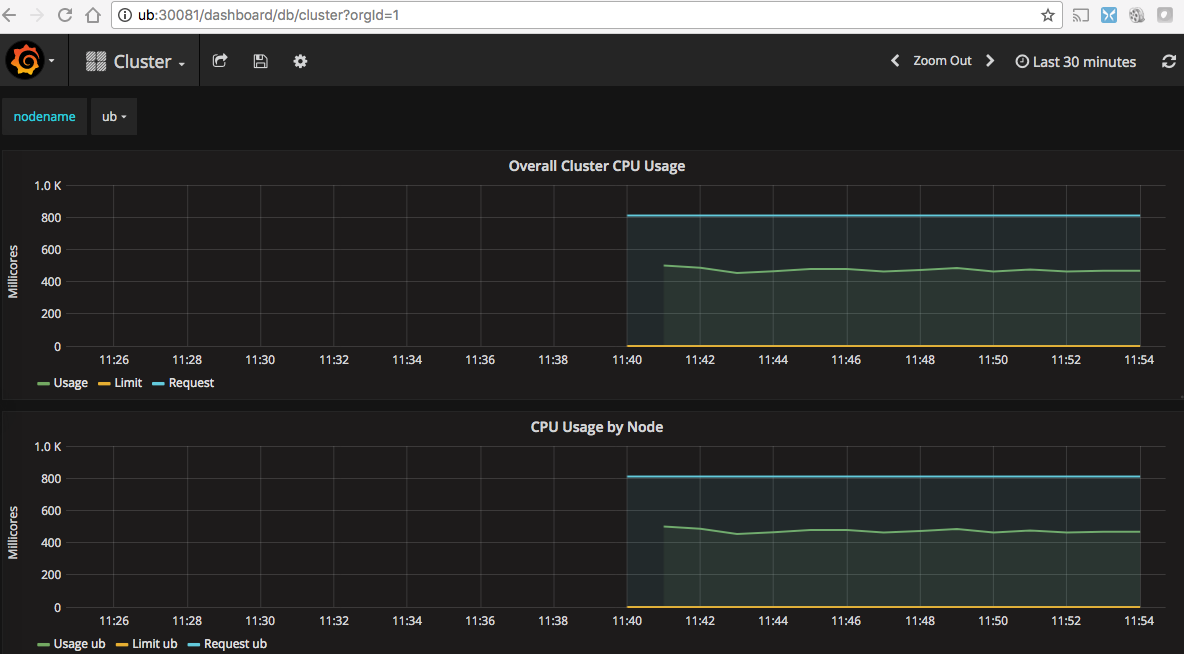
Then was able to go to the dashboard (http://{K8S_HOST}:{NodePort}) and see cluster information:
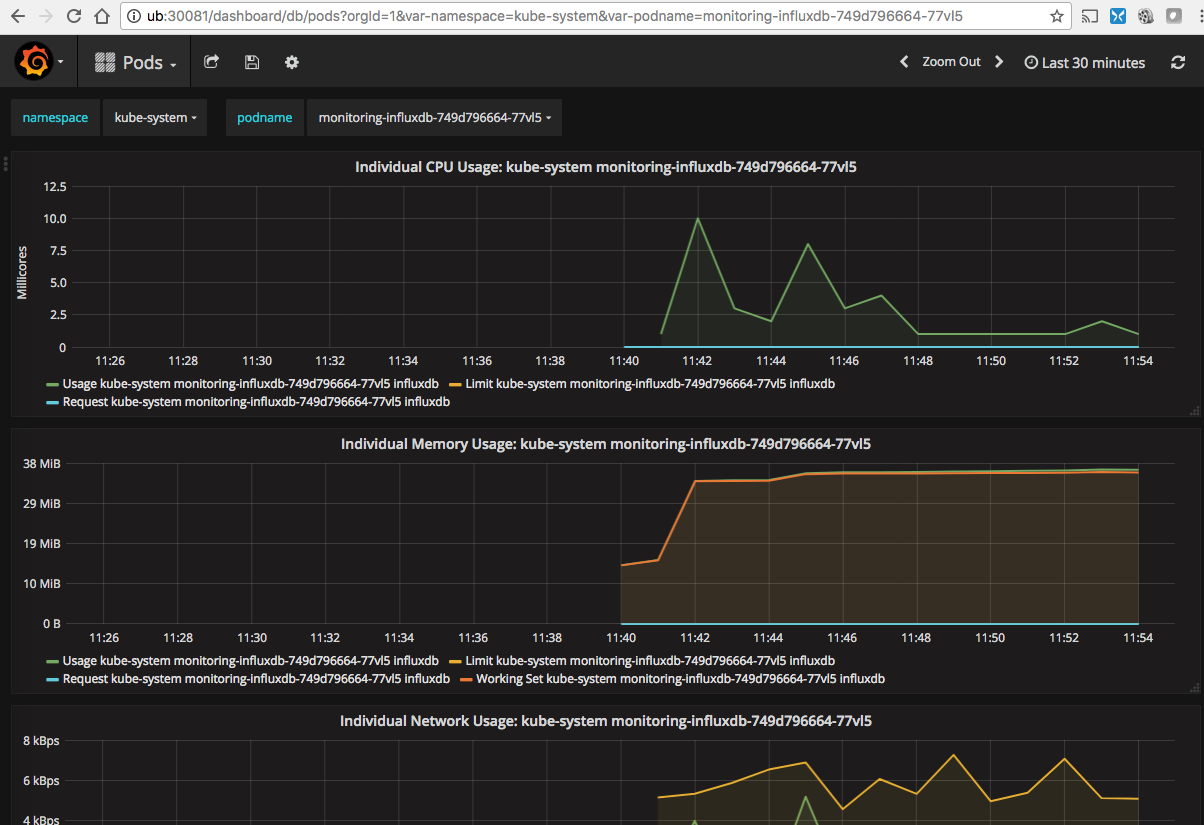
and also pod information:
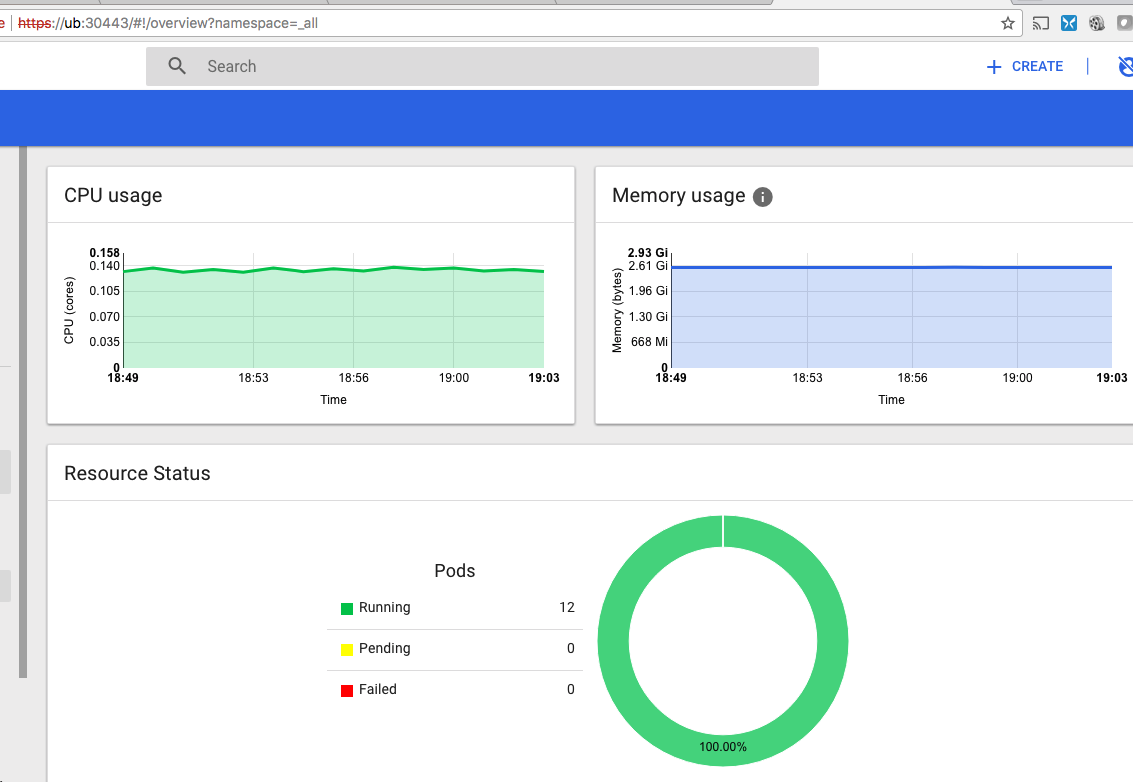
And also checking out the kubernetes Dashboard, I now saw CPU information as well:
Confirm Kubernetes DNS is working
The easiest thing to do is to just attach to a container running in kubernetes and run the following:
<> docker exec -it b931cce32e8e /bin/sh
$ ping -c 1 monitoring-influxdb.kube-system.svc
PING monitoring-influxdb.kube-system.svc.cluster.local (10.105.27.176): 56 data bytes
--- monitoring-influxdb.kube-system.svc.cluster.local ping statistics ---
1 packets transmitted, 0 packets received, 100% packet loss
It matched the IP of the deployment:
<> kubectl get service monitoring-influxdb --namespace=kube-system
NAME                  TYPE        CLUSTER-IP      EXTERNAL-IP   PORT(S)    AGE
monitoring-influxdb   ClusterIP   10.105.27.176   <none>        8086/TCP   23m
If configured appropriately with iptables you can also do a host lookup from the docker host it self:
<> host kubernetes.default.svc.cluster.local 10.96.0.10
Using domain server:
Name: 10.96.0.10
Address: 10.96.0.10#53
Aliases:

kubernetes.default.svc.cluster.local has address 10.96.0.1
and also the service it self:
<> host monitoring-influxdb.kube-system.svc.cluster.local 10.96.0.10
Using domain server:
Name: 10.96.0.10
Address: 10.96.0.10#53
Aliases:

monitoring-influxdb.kube-system.svc.cluster.local has address 10.105.27.176
Lastly you can also do a simple busybox deployment for testing (this is covered in Troubleshooting Tips). Here is a simple deploy config:
<> cat busybox/deploy.yaml
apiVersion: v1
kind: Pod
metadata:
  name: busybox
  namespace: default
spec:
  containers:
  - image: busybox
    command:
      - sleep
      - "3600"
    imagePullPolicy: IfNotPresent
    name: busybox
  restartPolicy: Never
  hostNetwork: true
  dnsPolicy: ClusterFirstWithHostNet
Then deploy it:
<> kubectl apply -f deploy.yaml
pod "busybox" created
Then do a test run
<> kubectl exec -it busybox nslookup kubernetes.default
Server:    10.96.0.10
Address 1: 10.96.0.10 kube-dns.kube-system.svc.cluster.local

Name:      kubernetes.default
Address 1: 10.96.0.1 kubernetes.default.svc.cluster.local
You can go one step further and make sure the port is reachable:
<> kubectl exec -it busybox /bin/sh
/ # telnet monitoring-influxdb.kube-system.svc 8086

HTTP/1.1 400 Bad Request
Content-Type: text/plain; charset=utf-8
Connection: close

400 Bad RequestConnection closed by foreign host