Monitoring Kubernetes with Metricbeat
I wanted to capture kubernetes events and send them to elasticsearch which I installed a couple of days before. I ran into a couple of guides and I wanted to give metricbeat a shot:
- Alerting on Kubernetes Events with EFK Stack
- Example: Add logging and metrics to the PHP / Redis Guestbook example
- Collect metrics with Elastic Metricbeat for monitoring Kubernetes
Also looking over the capabilities it looks pretty good: Metricbeat Reference -> Modules -> Kubernetes module
Installing Metricbeat on Kubernetes
So let’s use their helm charts to deploy metricbeat on my kubernetes cluster:
git clone https://github.com/elastic/helm-charts.git
cd helm-charts/metricbeat
Initially it complained about a dependency to kube-state-metrics, but I had already deployed that a while back (check out the Deploying kube-state-metrics on Kubernetes section below). So I move the requirement out of the way:
mv requirements.yaml requirements.yaml.orig
After that it worked:
> helm template -f /data/k8s/metricbeats/helm-values.yaml .
I took the above output and modified to match my needs. By default it deploys a daemonset and a deployment. From Running Metricbeat on Kubernetes:
You deploy Metricbeat in two different ways at the same time:
- As a DaemonSet to ensure that there’s a running instance on each node of the cluster. These instances are used to retrieve most metrics from the host, such as system metrics, Docker stats, and metrics from all the services running on top of Kubernetes.
- As a single Metricbeat instance created using a Deployment. This instance is used to retrieve metrics that are unique for the whole cluster, such as Kubernetes events or kube-state-metrics.
As a quick test I just concentrated on the daemonset. Then I ran into an issue with accessing cAdvisor and I saw the following in the logs of the pod:
k get logs -l app=metricbeat
error while getting metrics summary from Kubelet (<master-ip>:10255): Get http://<master-ip>:10255/stats/summary/: dial tcp <masterip>:10255: getsockopt: connection timed out
This turned out to be related to a new default with kubernetes and you can check out the Ensure cAdvisor Metrics are Available section on how to fix that.
In the configmaps the following sections ensure that metricbeat can talk to both:
kube-state-metrics-metricbeat.yml: |
    metricbeat.modules:
    - module: kubernetes
      enabled: true
      metricsets:
        - state_node
        - state_deployment
        - state_replicaset
        - state_pod
        - state_container
      period: 10s
      hosts: ["${KUBE_STATE_METRICS_HOSTS}"]
    output.elasticsearch:
      hosts: '${ELASTICSEARCH_HOSTS:elasticsearch:9200}'
and this one:
metricbeat.yml: |
    system:
      hostfs: /hostfs
    metricbeat.modules:
    - module: kubernetes
      metricsets:
        - container
        - node
        - pod
        - system
        - volume
      period: 10s
      host: "${NODE_NAME}"
      hosts: ["${NODE_NAME}:10255"]
      processors:
      - add_kubernetes_metadata:
          in_cluster: true
    - module: kubernetes
      enabled: true
      metricsets:
        - event
After you see the daemonset is good:
> k get ds metricbeat
NAME         DESIRED   CURRENT   READY   UP-TO-DATE   AVAILABLE   NODE SELECTOR   AGE
metricbeat   1         1         1       1            1           <none>          2d5h
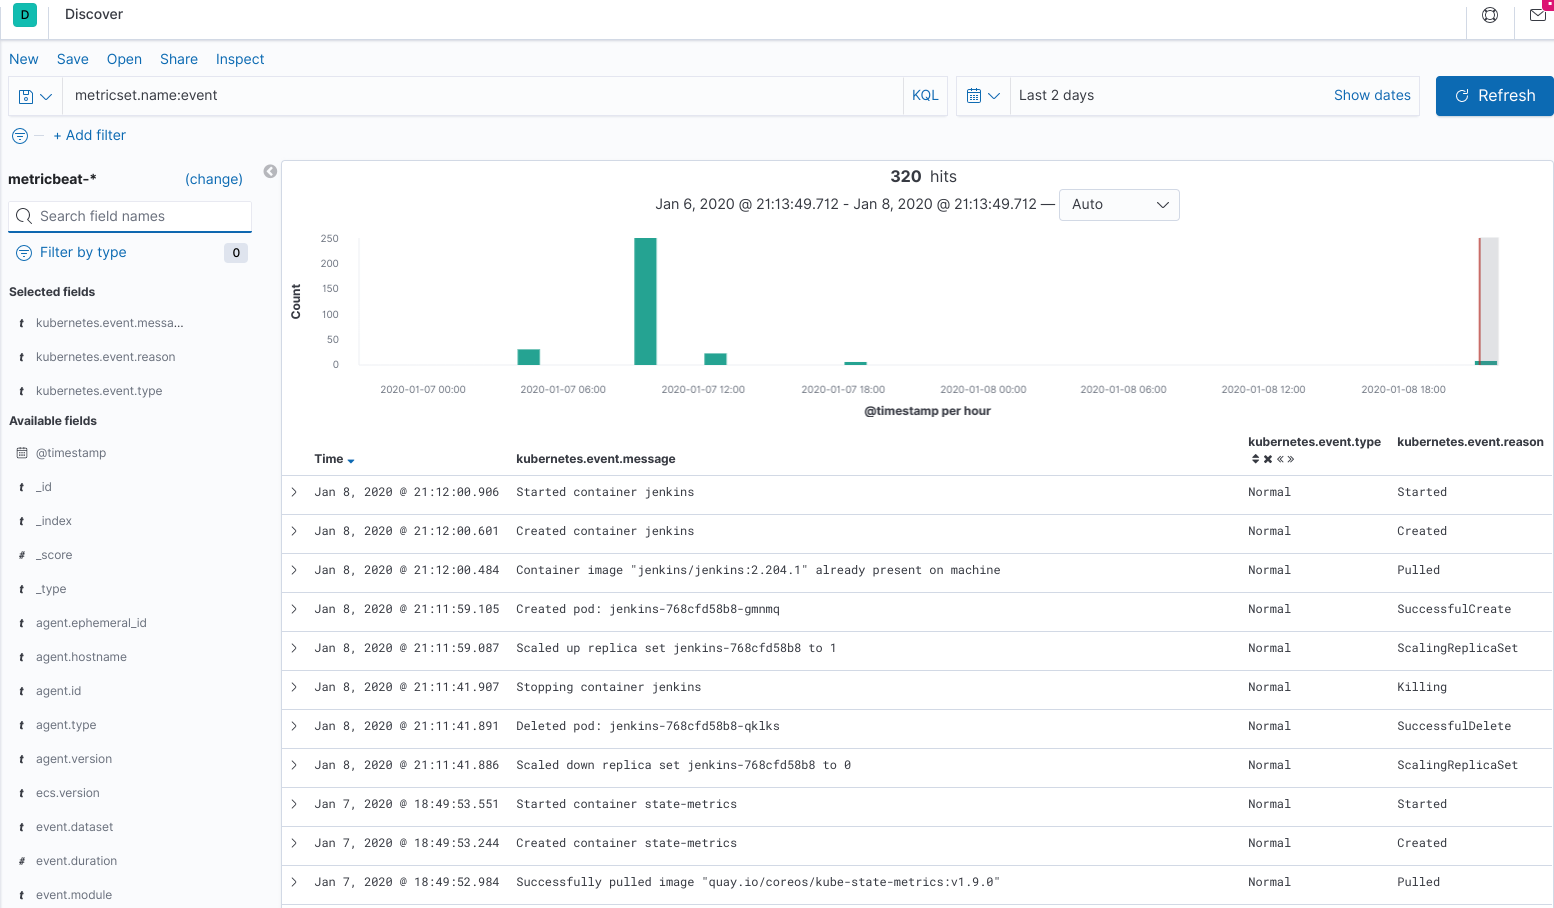
You can go to the kibana UI and under the Discovery section you should see all the kubernetes events coming in:
As a quick test you can also create a simple json query:
> cat /usr/local/apps/elasticsearch/kub-event-query.txt
{
  "from" : 0, "size" : 1,
  "query": {
    "bool": {
      "must": [
        {
          "query_string": {
            "fields" : ["metricset.name"],
                        "query": "metricset.name: event",
            "analyze_wildcard" : "true"
          }
        },
        {
          "range": {
           "@timestamp": {
             "gte": "now-1d"
           }
          }
        }
      ]
    }
  },
  "sort" : [
      {"@timestamp" : {"order" : "asc"}}
   ]
}
and then use curl to test it out:
> curl -XGET 'ub:39200/_search?pretty' -H 'Content-Type: application/json' -d @/usr/local/apps/elasticsearch/kub-event-query.txt
{
  "took" : 4,
  "timed_out" : false,
  "_shards" : {
    "total" : 5,
    "successful" : 3,
    "skipped" : 0,
    "failed" : 2,
    "failures" : [
      {
        "shard" : 0,
        "index" : ".kibana_1",
        "node" : "iw_yyU2bRJOdTBi8Qt0Dvw",
        "reason" : {
          "type" : "query_shard_exception",
          "reason" : "No mapping found for [@timestamp] in order to sort on",
          "index_uuid" : "LCyESsU_TnaPg7OQmUCMPw",
          "index" : ".kibana_1"
        }
      },
      {
        "shard" : 0,
        "index" : ".kibana_task_manager_1",
        "node" : "iw_yyU2bRJOdTBi8Qt0Dvw",
        "reason" : {
          "type" : "query_shard_exception",
          "reason" : "No mapping found for [@timestamp] in order to sort on",
          "index_uuid" : "DSEIvirLSsWRbIiOKr0Ecg",
          "index" : ".kibana_task_manager_1"
        }
      }
    ]
  },
  "hits" : {
    "total" : {
      "value" : 8,
      "relation" : "eq"
    },
    "max_score" : null,
    "hits" : [
      {
        "_index" : "metricbeat-7.5.1-2020.01.07-000001",
        "_type" : "_doc",
        "_id" : "1XKAiG8BycApguldO4un",
        "_score" : null,
        "_source" : {
          "@timestamp" : "2020-01-09T04:11:41.886Z",
          "ecs" : {
            "version" : "1.1.0"
          },
          "host" : {
            "name" : "metricbeat-sklgw"
          },
          "agent" : {
            "type" : "metricbeat",
            "ephemeral_id" : "b1ac652a-2cf1-4792-95d6-9835d13daa5c",
            "hostname" : "metricbeat-sklgw",
            "id" : "62e679ca-439e-490c-a670-8a3c43e90070",
            "version" : "7.5.1"
          },
          "event" : {
            "module" : "kubernetes",
            "dataset" : "kubernetes.event"
          },
          "metricset" : {
            "name" : "event"
          },
          "service" : {
            "type" : "kubernetes"
          },
          "kubernetes" : {
            "event" : {
              "timestamp" : {
                "last_occurrence" : "2020-01-09T04:11:41.000Z",
                "first_occurrence" : "2020-01-09T04:11:41.000Z"
              },
              "message" : "Scaled down replica set jenkins-768cfd58b8 to 0",
              "reason" : "ScalingReplicaSet",
              "type" : "Normal",
              "count" : 1,
              "involved_object" : {
                "uid" : "00723cb9-da14-4a9b-a1d4-39f67d86cb13",
                "api_version" : "apps/v1",
                "resource_version" : "35532898",
                "name" : "jenkins",
                "kind" : "Deployment"
              },
              "metadata" : {
                "timestamp" : {
                  "created" : "2020-01-09T04:11:41.000Z"
                },
                "name" : "jenkins.15e81c9671c9a22f",
                "namespace" : "default",
                "self_link" : "/api/v1/namespaces/default/events/jenkins.15e81c9671c9a22f",
                "generate_name" : "",
                "uid" : "cb5b29d2-948a-41e5-b99f-8850f97dd2cc",
                "resource_version" : "35532901"
              }
            }
          }
        },
        "sort" : [
          1578543101886
        ]
      }
    ]
  }
}
Adding Metricbeat Dashboards
I realized I was getting a bunch of information already so why not plot some of it. Metricbeat comes with some template dashboards, so let’s install them. The instructions are covered in Set up the Kibana dashboards. Here is what I did to install them:
> k exec -it metricbeat-ks9kt /bin/bash
[root@metricbeat-ks9kt metricbeat]# ./metricbeat setup --dashboards -E setup.kibana.host=kibana:5601
Loading dashboards (Kibana must be running and reachable)
Loaded dashboards
Then visiting the kibana UI and checking out the Dashboards, I saw the following:
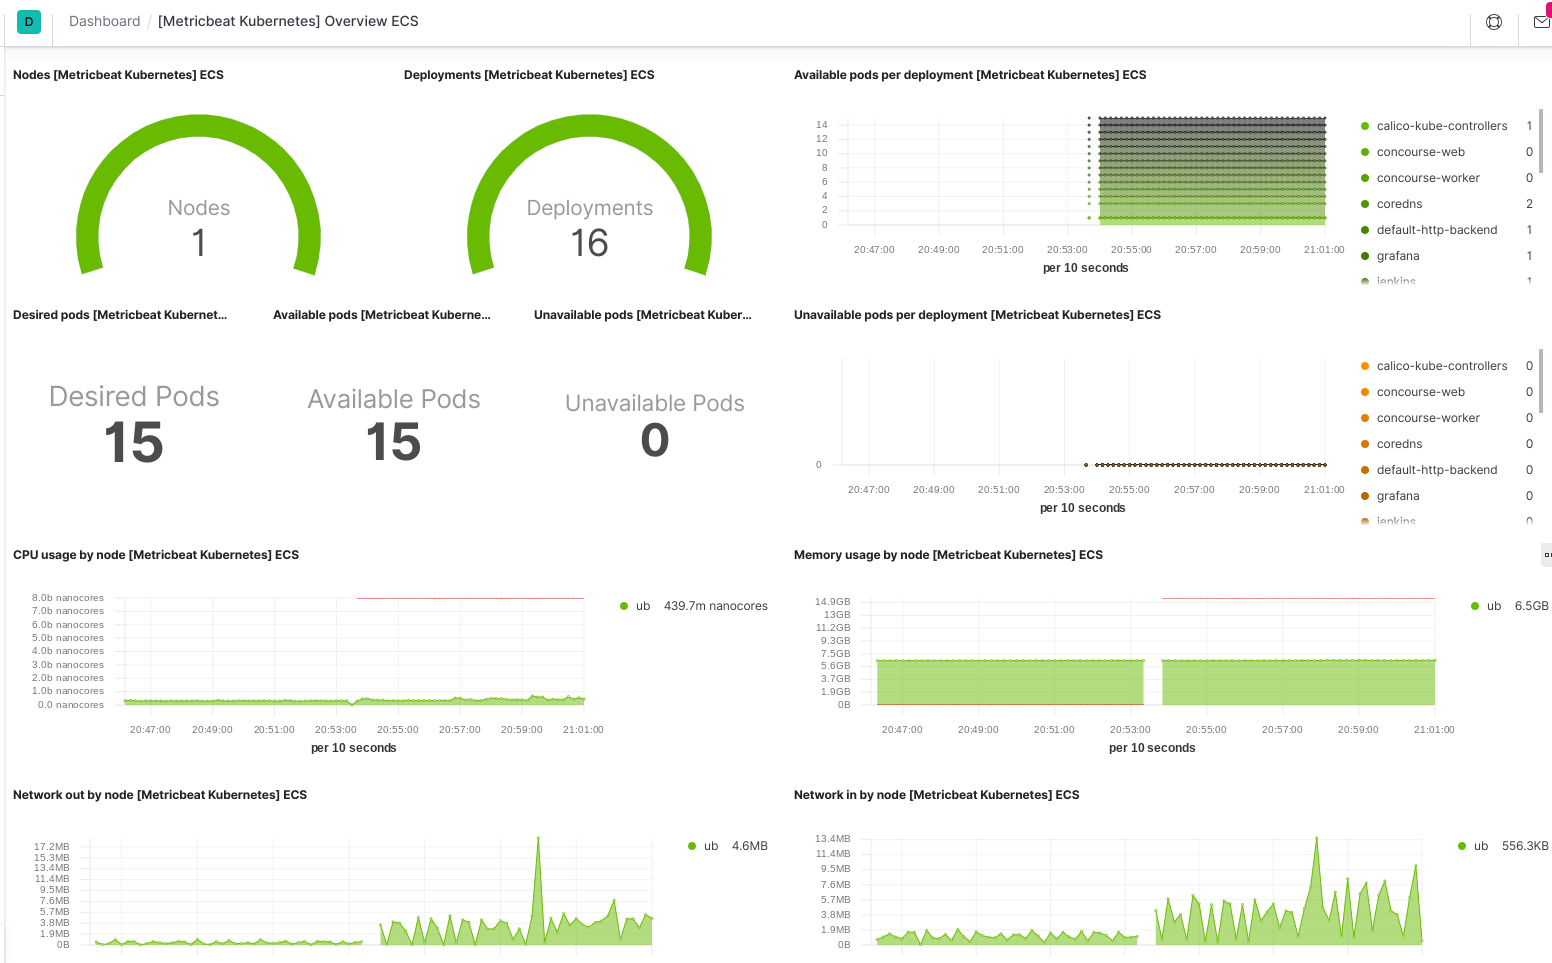
That’s pretty cool.
Deploying kube-state-metrics on Kubernetes
To install it I just followed the instructions from their git page
git clone https://github.com/kubernetes/kube-state-metrics.git
cd kube-state-metrics
k apply -f examples/standard
And then I was able to check out the available metrics by curling the service IP:
> curl http://10.96.202.127:8080/metrics -s | grep deployment_status_replicas_availab
# HELP kube_deployment_status_replicas_available The number of available replicas per deployment.
# TYPE kube_deployment_status_replicas_available gauge
kube_deployment_status_replicas_available{namespace="default",deployment="grafana"} 1
kube_deployment_status_replicas_available{namespace="default",deployment="wp-main"} 1
kube_deployment_status_replicas_available{namespace="kube-system",deployment="coredns"} 2
kube_deployment_status_replicas_available{namespace="kube-system",deployment="metrics-server"} 1
kube_deployment_status_replicas_available{namespace="default",deployment="jenkins"} 1
kube_deployment_status_replicas_available{namespace="ingress-nginx",deployment="default-http-backend"} 1
kube_deployment_status_replicas_available{namespace="default",deployment="kibana"} 1
kube_deployment_status_replicas_available{namespace="kube-system",deployment="tiller-deploy"} 1
kube_deployment_status_replicas_available{namespace="kube-system",deployment="calico-kube-controllers"} 1
kube_deployment_status_replicas_available{namespace="kube-system",deployment="state-metrics"} 1
kube_deployment_status_replicas_available{namespace="default",deployment="concourse-web"} 0
kube_deployment_status_replicas_available{namespace="default",deployment="concourse-worker"} 0
kube_deployment_status_replicas_available{namespace="default",deployment="puppet"} 1
kube_deployment_status_replicas_available{namespace="default",deployment="prometheus"} 1
kube_deployment_status_replicas_available{namespace="ingress-nginx",deployment="nginx-ingress-controller"} 1
The A Deep Dive into Kubernetes Metrics — Part 6: kube-state-metrics covers kube-state-metrics in great detail.
Ensure cAdvisor Metrics are Available
It’s becoming the default for port 10255 to be disabled:
- Disable the kubelet readonly port
- [Metricbeat] Access Kubernetes metrics from somewhere other than the read-only kublet port
- Analysis of a Kubernetes hack — Backdooring through kubelet
Since this was a private only cluster I decided to enable it. I saw that a couple of people did the same:
- Kubernetes data collection error with metricbeat!
- Read-only-port 10255 on Kubernetes node didn’t exist
After modifying my kubeadm systemd service and restarting kubelet, I was able to query the metrics:
> curl http://localhost:10255/metrics/cadvisor -s | head -3
# HELP cadvisor_version_info A metric with a constant '1' value labeled by kernel version, OS version, docker version, cadvisor version & cadvisor revision.
# TYPE cadvisor_version_info gauge
cadvisor_version_info{cadvisorRevision="",cadvisorVersion="",dockerVersion="18.09.7",kernelVersion="4.15.0-74-generic",osVersion="Ubuntu 18.04.3 LTS"} 1
and also the summary:
> curl http://localhost:10255/stats/summary -s | head
{
 "node": {
  "nodeName": "ub",
  "systemContainers": [
   {
    "name": "kubelet",
    "startTime": "2020-01-07T16:10:38Z",
    "cpu": {
     "time": "2020-01-08T04:44:01Z",
     "usageNanoCores": 107864934,
I found Native Kubernetes Monitoring, Part 1: Monitoring and Metrics for Users also pretty helpful in understanding how to interact with cAdvisor
Deploying metrics-server on Kubernetes
While I was installing all these addons I realized that a while back I had installed the metrics-server. I installed it by running the following:
git clone https://github.com/kubernetes-sigs/metrics-server.git
cd metrics-server
kubectl apply -f deploy/1.8+/
After that’s deployed you can use kubetctl top "nodes|pods". Here is how it looks like:
> k top pods
NAME                          CPU(cores)   MEMORY(bytes)
elasticsearch-0               50m          1402Mi
grafana-dbf9886d8-rqb8w       1m           42Mi
jenkins-768cfd58b8-gmnmq      7m           340Mi
kibana-6ff855d788-s4bvh       12m          338Mi
metricbeat-sklgw              44m          41Mi
prometheus-766d5b6d45-sbbtk   3m           55Mi
puppet-76798787df-phtf7       3m           1637Mi
wp-main-6785f97968-8c546      5m           69Mi
You can also query the API directly:
> TOKEN=$(kubectl get secrets -o jsonpath="{.items[?(@.metadata.annotations['kubernetes\.io/service-account\.name']=='default')].data.token}"|base64 --decode)
> curl -k https://$(k get svc -n kube-system metrics-server -o=jsonpath="{.spec.clusterIP}")/apis/metrics.k8s.io/v1beta1/pods -H "Authorization: Bearer $TOKEN" -s | head -23

{
  "kind": "PodMetricsList",
  "apiVersion": "metrics.k8s.io/v1beta1",
  "metadata": {
    "selfLink": "/apis/metrics.k8s.io/v1beta1/pods"
  },
  "items": [
    {
      "metadata": {
        "name": "nginx-ingress-controller-5946f47cc9-xnlsf",
        "namespace": "ingress-nginx",
        "selfLink": "/apis/metrics.k8s.io/v1beta1/namespaces/ingress-nginx/pods/nginx-ingress-controller-5946f47cc9-xnlsf",
        "creationTimestamp": "2020-01-09T06:43:37Z"
      },
      "timestamp": "2020-01-09T06:43:00Z",
      "window": "30s",
      "containers": [
        {
          "name": "nginx-ingress-controller",
          "usage": {
            "cpu": "5572570n",
            "memory": "193428Ki"
          }
Different Kuberenetes Metrics Options
It looks like there are multiple endpoints to get metrics from a kubernetes cluster. A couple of pages talk about the differences. From Kubernetes Monitoring with Prometheus -The ultimate guide (part 1).
cAdvisor: cAdvisor is an open source container resource usage and performance analysis agent. It is purpose-built for containers and supports Docker containers natively. In Kubernetes, cAdvisor runs as part of the Kubelet binary, any aggregator retrieving node local and Docker metrics will directly scrape the Kubelet Prometheus endpoints.
Kube-state-metrics: kube-state-metrics is a simple service that listens to the Kubernetes API server and generates metrics about the state of the objects such as deployments, nodes and pods. It is important to note that kube-state-metrics is just a metrics endpoint, other entity needs to scrape it and provide long term storage (i.e. the Prometheus server).
Metrics-server: Metrics Server is a cluster-wide aggregator of resource usage data. It is intended to be the default Heapster replacement. Again, the metrics server will only present the last datapoints and it’s not in charge of long term storage.
Thus:
- Kube-state metrics is focused on orchestration metadata: deployment, pod, replica status, etc.
- Metrics-server is focused on implementing the resource metrics API: CPU, file descriptors, memory, request latencies, etc.
And Kubernetes Metrics has a list of metrics to collect from each:
kube-state-metrics is a service that listens to the Kubernetes API server and generates metrics about the state of the objects, including deployments, nodes, and pods
kube-state-metrics metrics to collect
- Daemonsets
- kube_daemonset_status_current_number_scheduled
- kube_daemonset_status_desired_number_scheduled
- kube_daemonset_status_number_misscheduled
- kube_daemonset_status_number_unavailable
- kube_daemonset_metadata_generation
- Deployments
- kube_deployment_metadata_generation
- kube_deployment_spec_paused
- kube_deployment_spec_replicas
- kube_deployment_spec_strategy_rollingupdate_max_unavailable
- kube_deployment_status_observed_generation
- kube_deployment_status_replicas_available
- kube_deployment_status_replicas_unavailable
- Nodes
- kube_node_info
- kube_node_spec_unschedulable
- kube_node_status_allocatable
- kube_node_status_capacity
- kube_node_status_condition
- Pods
- kube_pod_container_info
- kube_pod_container_resource_requests
- kube_pod_container_resource_limits
- kube_pod_container_status_ready
- kube_pod_container_status_terminated_reason
- kube_pod_container_status_waiting_reason
- kube_pod_status_phase
cAdvisor (kubelet) metrics
cAdvisor is an open source container resource usage and performance analysis agent.
Metrics to collect
- container_cpu_load_average_10s
- container_cpu_system_seconds_total
- container_cpu_usage_seconds_total
- container_cpu_cfs_throttled_seconds_total
- container_memory_usage_bytes
- container_memory_swap
- container_spec_memory_limit_bytes
- container_spec_memory_swap_limit_bytes
- container_spec_memory_reservation_limit_bytes
- container_fs_usage_bytes
- container_fs_limit_bytes
- container_fs_writes_bytes_total
- container_fs_reads_bytes_total
- container_network_receive_bytes_total
- container_network_transmit_bytes_total
- container_network_receive_errors_total
- container_network_transmit_errors_total
And lastly from Tools for Monitoring Resources:
In Kubernetes, application monitoring does not depend on a single monitoring solution. On new clusters, you can use resource metrics or full metrics pipelines to collect monitoring statistics.
..
The resource metrics pipeline provides a limited set of metrics related to cluster components such as the Horizontal Pod Autoscaler controller, as well as the
kubectl toputility. These metrics are collected by the lightweight, short-term, in-memory metrics-server and are exposed via themetrics.k8s.ioAPI.metrics-server discovers all nodes on the cluster and queries each node’s kubelet for CPU and memory usage. The kubelet acts as a bridge between the Kubernetes master and the nodes, managing the pods and containers running on a machine.
..
The kubelet fetches this information from the integrated cAdvisor for the legacy Docker integration. It then exposes the aggregated pod resource usage statistics through the metrics-server Resource Metrics API. This API is served at
/metrics/resource/v1beta1
I guess as I understand it, metrics-server and cAdvisor work inconjuction to provide short-term resource metrics about containers and nodes. While kube-state-metrics provides metrics about the state of the deployed kubernetes resources in the cluster (like deployments, pods…etc)