Backing Up grafana Dashboards with grafcli
Installing grafcli
Initially I followed the instructions from the readme. Install with pip3 (I already had python install with brew):
> pip3 install grafcli
After that we can just copy the sample config:
> cp /usr/local/lib/python3.6/site-packages/etc/grafcli/grafcli.conf.example grafcli.conf
here is the sample config:
[grafcli]
editor = vim
mergetool = vimdiff
history = ~/.grafcli_history
verbose = off
force = on
colorize = on
[resources]
data-dir = ~/.grafcli
[hosts]
localhost = on
[localhost]
type = api
url = http://grafana:3000/api
user = admin
password = admin
I just modified the url to point to my instance of grafana, here is the final config:
> cat grafcli.conf
[grafcli]
editor = vim
mergetool = vimdiff
history = ~/.grafcli_history
verbose = off
force = on
colorize = on
[resources]
data-dir = ~/.grafcli
[hosts]
test-grafana = on
[test-grafana]
type = api
url = https://grafana.local.com/api
user = admin
password = admin
and then I was able to query all the dashboards:
> grafcli ls remote/test-grafana
aws-cloudwatch-browser
ecs-dashboard
influxdb
nginx
postgres-overview
rabbitmq-message-stats
telegraf-metrics
test-monitoring
vault
Backing up all the Dashboards
It should be as easy as running:
> grafcli backup remote/test-grafana backups.tgz
But I ran into this error:
Traceback (most recent call last):
 File "./grafcli", line 27, in <module>
  sys.exit(main())
 File "./grafcli", line 13, in main
  result = cli.execute(*sys.argv[1:])
 File "/usr/local/lib/python3.6/site-packages/climb/core.py", line 79, in execute
  return self._commands.execute(command, **kwargs)
 File "/usr/local/lib/python3.6/site-packages/climb/commands.py", line 26, in execute
  return method(*args, **kwargs)
 File "/usr/local/lib/python3.6/site-packages/grafcli/commands.py", line 213, in backup
  self.file_export(doc_path, file_path)
 File "/usr/local/lib/python3.6/site-packages/grafcli/commands.py", line 244, in file_export
  document = self._resources.get(path)
 File "/usr/local/lib/python3.6/site-packages/grafcli/resources/resources.py", line 46, in get
  return manager.get(*parts)
 File "/usr/local/lib/python3.6/site-packages/grafcli/resources/common.py", line 33, in get
  dashboard = self._storage.get(dashboard_name)
 File "/usr/local/lib/python3.6/site-packages/grafcli/storage/api.py", line 45, in get
  return Dashboard(source['dashboard'], dashboard_id)
 File "/usr/local/lib/python3.6/site-packages/grafcli/documents.py", line 95, in __init__
  self._load(source)
 File "/usr/local/lib/python3.6/site-packages/grafcli/documents.py", line 101, in _load
  for row in source['rows']:
It looks like it’s a known issue with the new version of grafana, and it’s discussed in this github issue. It looks like there is a test branch available to try it out.
Using grafcli from github
So I first uninstalled the one from pip:
> pip3 uninstall grafcli
and then I cloned the one from github and checked out the new branch:
> git clone https://github.com/m110/grafcli.git
> git branch -r
 origin/HEAD -> origin/master
 origin/experimental-v5
 origin/master
> git checkout experimental-v5
the new version of the script is in the scripts directory:
> cd grafcli/scripts
And as a quick test we export an environment variable to use the test directory to locate python modules:
> export PYTHONPATH=/Users/elatov/stuff/ext-repos/grafcli
And then I was able to do a backup without issues (first let’s copy the original config file we created):
> cp ~/grafcli.conf .
> ./grafcli backup remote/test-grafana backups.tgz
And we can see all the jsons for the dashboards:
> tar tvzf backups.tgz
-rw-r--r-- 0 elatov admins 19804 May 31 09:32 aws-cloudwatch-browser.json
-rw-r--r-- 0 elatov admins 43592 May 31 09:32 ecs-dashboard.json
-rw-r--r-- 0 elatov admins 29188 May 31 09:32 influxdb.json
-rw-r--r-- 0 elatov admins 16635 May 31 09:32 nginx.json
-rw-r--r-- 0 elatov admins 87097 May 31 09:32 postgres-overview.json
-rw-r--r-- 0 elatov admins 34459 May 31 09:32 rabbitmq-message-stats.json
-rw-r--r-- 0 elatov admins 1378035 May 31 09:32 telegraf-metrics.json
-rw-r--r-- 0 elatov admins  83010 May 31 09:32 test-monitoring.json
-rw-r--r-- 0 elatov admins  58146 May 31 09:32 vault.json
That looks good.
Confirm the Restore Works
As a quick test, I wanted to make sure the backups are valid. So I stood up a test grafana instance and tried importing. For the test instance, I made sure I used the same version as what we have in test:
> cat docker-compose.yml
version: "2"
services:
 grafana:
  image: grafana/grafana:5.1.2
  ports:
   - 3000:3000
Then stood that up:
> docker-compose up -d
and I was able to login to an empty grafana instance running on my local laptop (default creds are admin/admin):
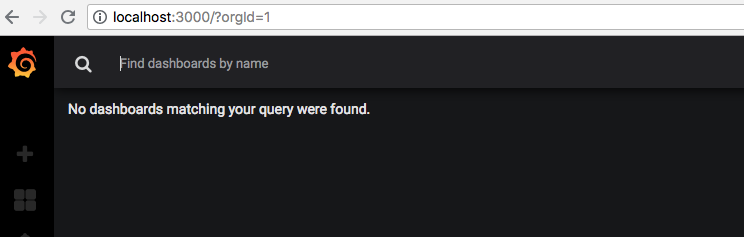
Then I modified the grafcli.conf file to include a second host:
> cat grafcli.conf
[grafcli]
editor = vim
mergetool = vimdiff
history = ~/.grafcli_history
verbose = off
force = on
colorize = on
[resources]
data-dir = ~/.grafcli
[hosts]
test-grafana = on
local = on
[test-grafana]
type = api
url = https://grafana.local.com/api
user = admin
password = admin
[local]
type = api
url = http://localhost:3000/api
user = admin
password = admin
and then make sure no dashboards are there:
> ./grafcli ls remote/local
>
Initially when I tried the import, it actually failed:
> ./grafcli restore backups.tgz remote/local
Traceback (most recent call last):
 File "./grafcli", line 27, in <module>
  sys.exit(main())
 File "./grafcli", line 13, in main
  result = cli.execute(*sys.argv[1:])
 File "/usr/local/lib/python3.6/site-packages/climb/core.py", line 79, in execute
  return self._commands.execute(command, **kwargs)
 File "/usr/local/lib/python3.6/site-packages/climb/commands.py", line 26, in execute
  return method(*args, **kwargs)
 File "/Users/elatov/stuff/ext-repos/grafcli/grafcli/commands.py", line 233, in restore
  self.file_import(file_path, doc_path)
 File "/Users/elatov/stuff/ext-repos/grafcli/grafcli/commands.py", line 265, in file_import
  self._resources.save(path, document)
 File "/Users/elatov/stuff/ext-repos/grafcli/grafcli/resources/resources.py", line 51, in save
  return manager.save(document, *parts)
 File "/Users/elatov/stuff/ext-repos/grafcli/grafcli/resources/common.py", line 95, in save
  self._storage.save(dashboard.id, dashboard)
 File "/Users/elatov/stuff/ext-repos/grafcli/grafcli/storage/api.py", line 63, in save
  self._call('POST', 'dashboards/db', data)
 File "/Users/elatov/stuff/ext-repos/grafcli/grafcli/storage/api.py", line 30, in _call
  response.raise_for_status()
 File "/usr/local/lib/python3.6/site-packages/requests/models.py", line 935, in raise_for_status
  raise HTTPError(http_error_msg, response=self)
requests.exceptions.HTTPError: 500 Server Error: Internal Server Error for url: http://localhost:3000/api/dashboards/db
Checking out the logs on the container, I saw the following:
grafana_1 | t=2018-05-31T13:43:42+0000 lvl=info msg="Initializing HTTP Server" logger=http.server address=0.0.0.0:3000 protocol=http subUrl= socket=
grafana_1 | t=2018-05-31T13:44:41+0000 lvl=info msg="Request Completed" logger=context userId=0 orgId=0 uname= method=GET path=/ status=302 remote_addr=172.23.0.1 time_ms=0 size=29 referer=
grafana_1 | t=2018-05-31T13:49:11+0000 lvl=eror msg="Dashboard not found" logger=context userId=1 orgId=1 uname=admin error="Dashboard not found"
grafana_1 | t=2018-05-31T13:49:11+0000 lvl=info msg="Request Completed" logger=context userId=1 orgId=1 uname=admin method=GET path=/api/dashboards/db/postgres-overview status=404 remote_addr=172.23.0.1 time_ms=19 size=33 referer=
grafana_1 | t=2018-05-31T13:49:11+0000 lvl=eror msg="Dashboard not found" logger=context userId=1 orgId=1 uname=admin error="Dashboard not found"
Looking up the error, it looks like it’s a known issue with our version of grafana. This is discussed in Invalid alert data. Cannot save dashboard. From that page:
For those encountering issues importing dashboards with alert settings from 5.0.4 to 5.1.3 and getting the same error. Try looking for dashboard: null in your dashboard JSON (mine is from Share -> Export -> View JSON):
“dashboard”: null
And replace it with a value like:
“dashboard”: $datasource
Then import using the UI (paste json), this worked for me .
I extracted the tar archive:
> mkdir restore
> cp backup.tgz restore/.
> cd restore
> tar xvzf backups.tgz
x aws-cloudwatch-browser.json
x ecs-dashboard.json
x influxdb.json
x nginx.json
x postgres-overview.json
x rabbitmq-message-stats.json
x telegraf-metrics.json
x test-monitoring.json
x vault.json
and tried a manual import and did get the same error:

Going into the alerts section of the dashboard I saw the following:

By default the datasource is set to the test data and you can’t create alerts based on that type of a datasource. I did notice a bug for that (Provisioning dashboard with alert rules should create alerts). And it looks like that should be fixed in 5.1.3 (the next version as of 05-31-18). So I expanded my docker-compose config to include an influxdb service:
> cat docker-compose.yml
version: "2"
services:
 grafana:
  container_name: grafana
  image: grafana/grafana:5.1.2
  ports:
   - 3000:3000
  links:
   - influxdb
  environment:
   environment:
   INFLUXDB_DB: grafana
   INFLUXDB_USER: grafana_user
   INFLUXDB_USER_PASSWORD: password
 influxdb:
  container_name: influxdb
  image: library/influxdb:1.5.2
  ports:
   - 8086:8086
And then, I manually created the datasource in grafana and (make sure you check the default option):

then the restore worked:
