Sending Logs To Loki
I had a couple of use cases, let’s try to cover them one by one.
Sending Kubernetes Logs and events to Loki
There are instructions in Send Kubernetes metrics, logs, and events to Grafana Cloud with Helm and Argo CD. I was surprised to see an example for ArgoCD, but I was also really happy. Then I reviewed the logs-only example from grafana. The only thing I was missing was getting the right version of the helm chart. It was actually one behind from the releases in github. So I added the repo and checked with helm:
> helm repo add grafana https://grafana.github.io/helm-charts
> helm repo update
> helm search repo grafana/k8s-monitoring
NAME                      CHART VERSION    APP VERSION    DESCRIPTION
grafana/k8s-monitoring    0.7.3            1.6.1          A Helm chart for gathering, scraping, and forwa...
Then I just created my ArgoCD application and after it deployed I saw all the pods in the cluster:
> k get po -l app.kubernetes.io/name=grafana-agent-logs
NAME                                                   READY   STATUS    RESTARTS   AGE
grafana-k8s-monitoring-home-grafana-agent-logs-7mgrw   2/2     Running   0          13m
grafana-k8s-monitoring-home-grafana-agent-logs-b8m6p   2/2     Running   0          13m
grafana-k8s-monitoring-home-grafana-agent-logs-kx7zs   2/2     Running   0          13m
I also learned a neat trick with ArgoCD, you can specify wild cards for versions and it will grab the latest version of the helm chart. It looks like there is a github discussion on that. After that’s done you can search for your cluster and see the container logs:
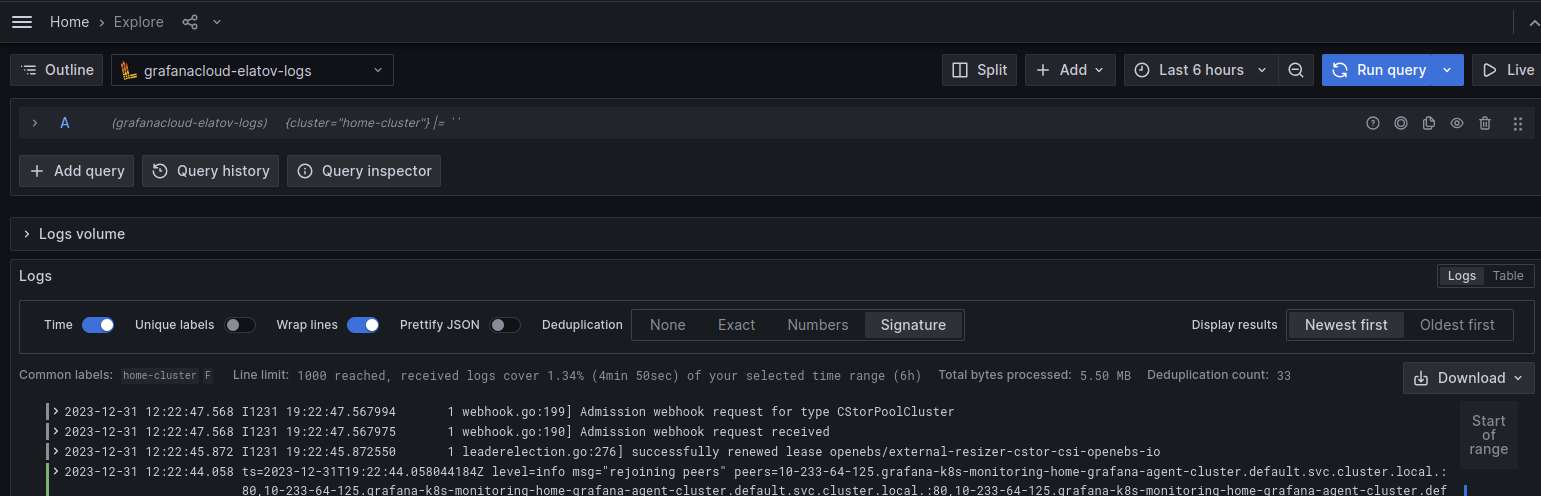
Then if you go a little further and add the job="integrations/kubernetes/eventhandler" label, you will only see the kubernetes events:

Sending Logs from Syslog clients
There is a syslog source from Loki, and there are lot of good documentation on how to accomplish this with promtail:
It seems as though the grafana agent has replaced promtail. There is a nice discussion in this github issue. So I decided try to use grafana agent for this configuration. There is already a nice grafana agent helm chart and I saw a nice example of the configuration here. Using the same approach as above, I deployed that helm chart with ArgoCD and I had more grafana agent pods running in the same cluster:
> k get po -l app.kubernetes.io/instance=grafana-agent-home
NAME                       READY   STATUS    RESTARTS   AGE
grafana-agent-home-494k9   2/2     Running   0          2d16h
grafana-agent-home-hxnvn   2/2     Running   0          2d16h
grafana-agent-home-zfcwg   2/2     Running   0          2d16h
Modifying rsyslog configuration to send RFC5424 format
As a quick test I added the following file on one my linux boxes:
> cat /etc/rsyslog.d/test-grafana.conf
*.* @192.168.1.202
After enabling that, I saw a bunch of errors on the grafana agent pods:
> k logs grafana-agent-home-j5zf8 | tail
Defaulted container "grafana-agent" out of: grafana-agent, config-reloader
ts=2023-12-28T07:59:01.806692026Z level=warn msg="error parsing syslog stream" component=loki.source.syslog.syslog err="expecting a version value in the range 1-999 [col 4]"
ts=2023-12-28T07:59:02.812806196Z level=warn msg="error parsing syslog stream" component=loki.source.syslog.syslog err="expecting a version value in the range 1-999 [col 4]"
ts=2023-12-28T08:00:01.351971281Z level=warn msg="error parsing syslog stream" component=loki.source.syslog.syslog err="expecting a version value in the range 1-999 [col 4]"
ts=2023-12-28T08:00:01.356710055Z level=warn msg="error parsing syslog stream" component=loki.source.syslog.syslog err="expecting a version value in the range 1-999 [col 4]"
I needed to modify my rsyslog configuration to make sure it sends RFC5424 syslog format. After reading a couple of other sites
I had to add the following two options to my /etc/rsyslog.conf file:
input(type="imuxsock" socket="/dev/log" useSpecialParser="off")
module(load="builtin:omfile" Template="RSYSLOG_SyslogProtocol23Format")
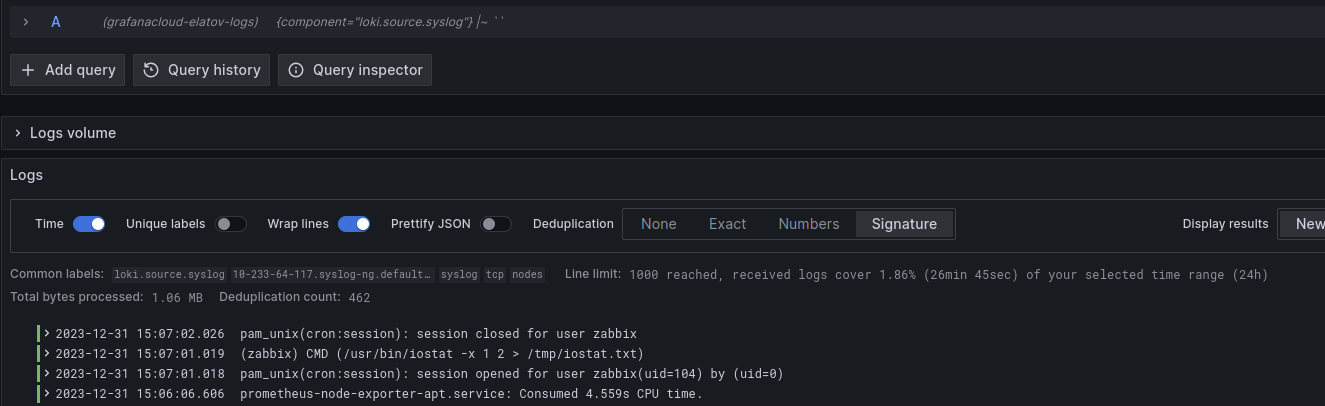
After that the grafana-agent stopped throwing errors and I saw them getting forwarded to loki. Using a simple filter like this {component="loki.source.syslog"}, you should be able to see those logs:
As a side note, it does looks like there may be support for RFC3164 syslog format soon based on this github issue
pfSense logs
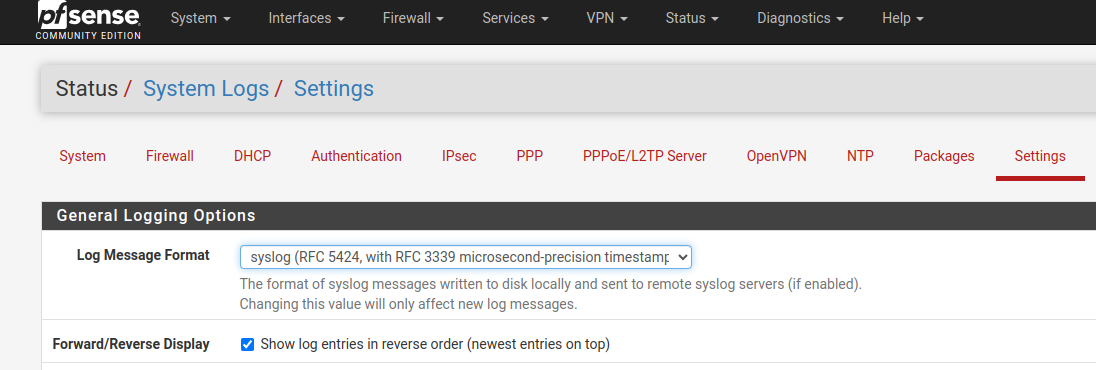
When I tried to enable RFC5464 on the pfSense side:
grafana-agent kept failing to parse the logs:
ts=2023-12-28T08:00:01.356710055Z level=warn msg="error parsing syslog stream" component=loki.source.syslog.syslog err="found EOF after \"
I found an old loki issue, but at this point I decided to deploy a syslog relay. There are some examples at:
- How I fell in love with logs thanks to Grafana Loki
- grafana-loki-syslog-aio example
- Forwarding Syslog Messages to Loki via Promtail and syslog-ng with mTLS
- Using Rsyslog and Promtail to relay syslog messages to Loki
On top of those the Configuring syslog-ng relays page was really helpful in getting the right config. I also decided to use the this syslog-ng container. It felt like it was the most up to date one. There are also helm charts available here it uses the balabit container which also seems like it’s kept up to date.
After you deploy the pod, check out the /config/log/current file inside the container, it will tell you if anything is wrong with the syslog-ngconfig:
root@syslog-ng-77cccd8fdd-vsbj5:/# cd /config/log/
root@syslog-ng-77cccd8fdd-vsbj5:/config/log# cat current
2023-12-28 23:06:56.557137080  [2023-12-28T23:06:56.557108] ERROR: configuration files without a version number have become unsupported in syslog-ng 3.13, please specify a version number using @version as the first line in the configuration file;
2023-12-28 23:06:57.579632598  Error parsing config, syntax error, unexpected LL_IDENTIFIER, expecting '}' in /config/syslog-ng.conf:6:5-6:28:
2023-12-28 23:06:57.579636026  1       source s_local {
2023-12-28 23:06:57.579637181  2           internal();
2023-12-28 23:06:57.579638260  3       };
If all is well, you will see something like this:
root@syslog-ng-7f4dbd6cf5-jhbj8:/config/log# tail current
2023-12-28 23:42:08.681227564  [2023-12-28T23:42:08.681116] syslog-ng starting up; version='4.1.1'
2023-12-28 23:42:08.681287879  [2023-12-28T23:42:08.681225] Syslog connection established; fd='12', server='AF_INET(10.233.34.83:1514)', local='AF_INET(0.0.0.0:0)'
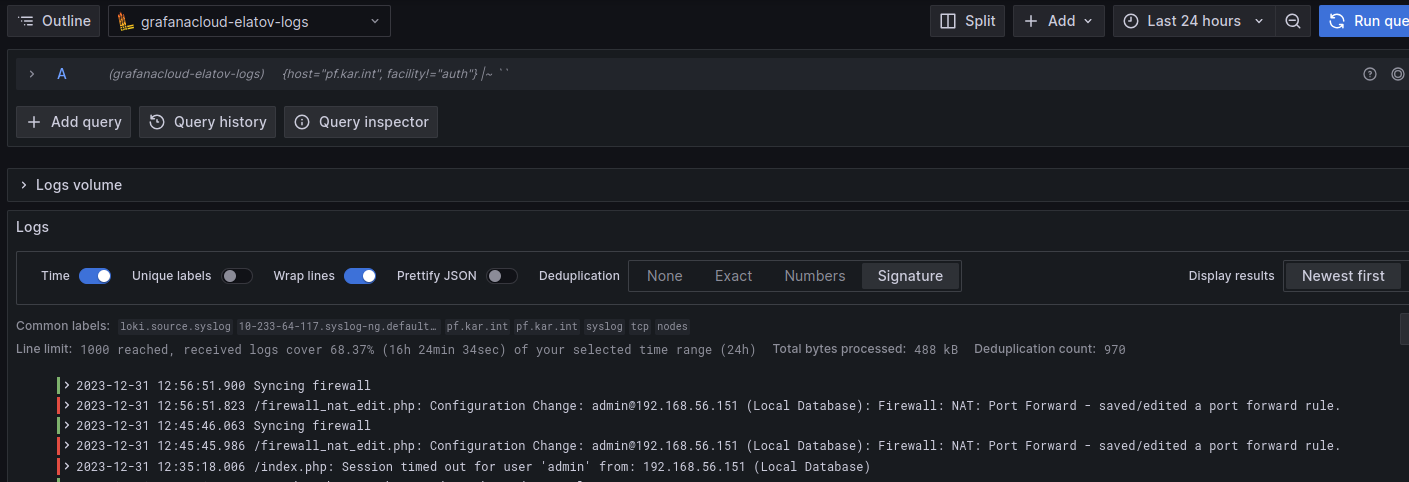
And you can see it was able to connect to the grafana-agent on port 1514 as well. Since I was forwarding the hostname with the syslog-ng pods, I was able to search by the hostname of my pfsense instance:
Forwarding Journalctl Logs
Surprisingly journalctl doesn’t support remote syslog. It’s been a request for a a while now: systemd issue 7170. Luckily grafana agent intergrates with that as well. I ended up using the approach for my proxmox host (this was briefly discussed at the grafana community board). First install the agent following the install docs:
sudo mkdir -p /etc/apt/keyrings/
wget -q -O - https://apt.grafana.com/gpg.key | gpg --dearmor | sudo tee /etc/apt/keyrings/grafana.gpg > /dev/null
echo "deb [signed-by=/etc/apt/keyrings/grafana.gpg] https://apt.grafana.com stable main" | sudo tee /etc/apt/sources.list.d/grafana.list

sudo apt-get update

sudo apt-get install grafana-agent-flow
Then configure it following the instructions from here. And finally just start it:
sudo systemctl enable grafana-agent-flow.service
sudo systemctl start grafana-agent-flow
Confirm it’s running:
root@pm:~# systemctl status grafana-agent-flow
grafana-agent-flow.service - Vendor-neutral programmable observability pipelines.
     Loaded: loaded (/lib/systemd/system/grafana-agent-flow.service; enabled; preset: enabled)
     Active: active (running) since Sat 2023-12-30 17:46:59 MST; 7min ago
       Docs: https://grafana.com/docs/agent/latest/flow/
   Main PID: 1504905 (grafana-agent-f)
      Tasks: 13 (limit: 38170)
     Memory: 31.2M
        CPU: 1.501s
     CGroup: /system.slice/grafana-agent-flow.service
             └─1504905 /usr/bin/grafana-agent-flow run --storage.path=/var/lib/grafana-agent-flow /etc/grafana-agent-flow.river

Dec 30 17:46:59 pm grafana-agent-flow[1504905]: ts=2023-12-31T00:46:59.894604037Z level=info msg="finished node evaluation" controller_id="" trace_id=2938f8ba36ae0345a>
Dec 30 17:46:59 pm grafana-agent-flow[1504905]: ts=2023-12-31T00:46:59.894616976Z level=info msg="finished node evaluation" controller_id="" trace_id=2938f8ba36ae0345a>
Dec 30 17:46:59 pm grafana-agent-flow[1504905]: ts=2023-12-31T00:46:59.894630667Z level=info msg="finished node evaluation" controller_id="" trace_id=2938f8ba36ae0345a>
Dec 30 17:46:59 pm grafana-agent-flow[1504905]: ts=2023-12-31T00:46:59.89464075Z level=info msg="finished complete graph evaluation" controller_id="" trace_id=2938f8ba>
Dec 30 17:46:59 pm grafana-agent-flow[1504905]: ts=2023-12-31T00:46:59.894715387Z level=info msg="scheduling loaded components and services"
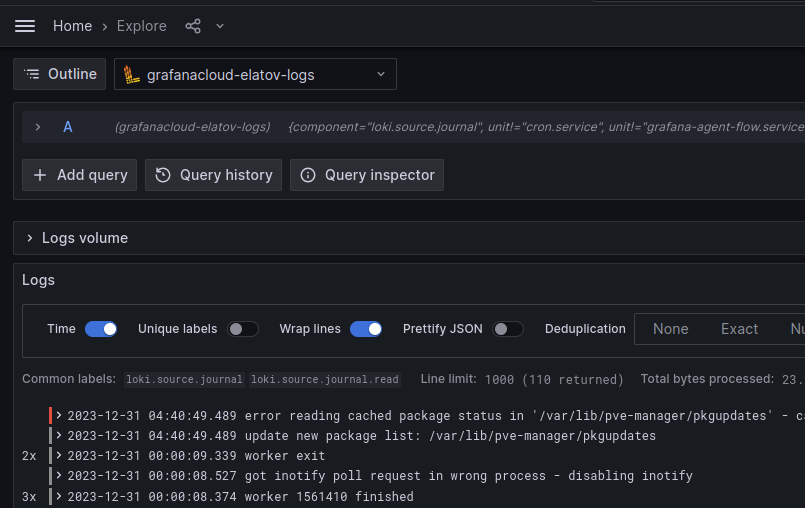
Using this filter {component="loki.source.journal"}, you’ll be able to see the logs collected from journalctl:
I think I covered all the cases I needed :)