10GB And Thunderbolt iSCSI SSD Testing
I wanted to test out some 10Gb benchmarks just because I thought my home lab was getting old. I had a mac-mini machine and it doesn’t have a 10Gb Nic, but it does have a thunderbolt port which has a theoritical thoughput of 10Gb. So I decided to buy a 10Gb Nic for my storage machine, a 10GB switch, and a thunderbolt to 10Gb converter for the mac-mini.
The Hardware
I ended up getting the following:
- Intel Ethernet Converged Network Adapter X540T1 ($300 at amazon)
- NETGEAR ProSAFE XS708E 8-Port 10G Ethernet Switch ($750 at amazon)
- Sonnet Technologies Twin 10G Thunderbolt 2 to Dual Port Copper 10 Gigabit Ethernet Adapter ($500 at amazon)
I already had CAT7 Ethernet cables and an Apple Thunderbolt cable. I was still using the same Storage machine as described in my previous post.
OmniOS Configure 10Gb Interface
I powered off the machine and inserted the 10Gb Nic into the PCIe 3.0 slot. After rebooting I confirmed the driver picked up the 10GB nic:
┌─[root@zfs] - [/root] - [2016-01-03 09:11:14]
└─[0] <> dladm show-phys
LINK         MEDIA                STATE      SPEED  DUPLEX    DEVICE
e1000g0      Ethernet             up         1000   full      e1000g0
ixgbe0       Ethernet             up         10000  full      ixgbe0
Then I ran the following to IP the 10Gb Nic:
┌─[root@zfs] - [/root] - [2016-01-03 09:36:13]
└─[1] <> ipadm create-if ixgbe0
┌─[root@zfs] - [/root] - [2016-01-03 09:36:27]
└─[0] <> ipadm create-addr -T static -a 10.1.0.3/24 ixgbe0/v4static
┌─[root@zfs] - [/root] - [2016-01-03 09:36:59]
└─[0] <> ping 10.1.0.4
10.1.0.4 is alive
Benchmarking the Network Throughput
I had a macair and I decided to run some iperf tests between the Storage Machine and the Mac Air, Here was the initial test:
┌─[elatov@macair] - [/Users/elatov] - [2016-01-03 09:50:01]
└─[0] <> iperf -c 10.1.0.3 -w 2m -t 30
------------------------------------------------------------
Client connecting to 10.1.0.3, TCP port 5001
TCP window size: 2.00 MByte (WARNING: requested 2.00 MByte)
------------------------------------------------------------
[  4] local 10.1.0.4 port 49310 connected with 10.1.0.3 port 5001
[ ID] Interval       Transfer     Bandwidth
[  4]  0.0-30.0 sec  25.7 GBytes  7.36 Gbits/sec
Enable Jumbo Frames on Omnios
Next I decided to try out enabling Jumbo frames, here is how that looked like on the OmniOS machine:
┌─[root@zfs] - [/root] - [2016-01-03 09:54:14]
└─[127] <> ipadm delete-if ixgbe0
┌─[root@zfs] - [/root] - [2016-01-03 09:54:18]
└─[0] <> dladm set-linkprop -t -p mtu=9000 ixgbe0
┌─[root@zfs] - [/root] - [2016-01-03 09:54:22]
└─[0] <> ipadm create-if ixgbe0
┌─[root@zfs] - [/root] - [2016-01-03 09:54:35]
└─[0] <> ipadm create-addr -T static -a 10.1.0.3/24 ixgbe0/v4static
This set the MTU temporarily, if you want it permanently then you can remove the -t flag from the dladm set-linkprop command. To confirm the jumbo frames are enabled, we can use the dladm command:
┌─[root@zfs] - [/root] - [2016-01-03 09:55:41]
└─[0] <> dladm show-link
LINK        CLASS     MTU    STATE    BRIDGE     OVER
e1000g0     phys      1500   up       --         --
ixgbe0      phys      9000   up       --         --
When I ran the iperf test it was almost the same results. Here is the interface config on the OSX side:
┌─[elatov@macair] - [/Users/elatov] - [2016-01-03 09:56:47]
└─[0] <> ifconfig en4
en4: flags=8863<UP,BROADCAST,SMART,RUNNING,SIMPLEX,MULTICAST> mtu 9000
        options=2b<RXCSUM,TXCSUM,VLAN_HWTAGGING,TSO4>
        ether 00:30:93:0c:05:c7
        inet6 fe80::230:93ff:fe0c:5c7%en4 prefixlen 64 scopeid 0x9
        inet 10.1.0.4 netmask 0xffffff00 broadcast 10.1.0.255
        nd6 options=1<PERFORMNUD>
        media: 10GbaseT <full-duplex,flow-control>
        status: active
Benchmarking with Linux
My Macair duals boots macosx and Arch Linux, so I rebooted into Arch Linux and the Nic was picked up by the appropriate driver:
┌─[elatov@air] - [/home/elatov] - [2016-01-03 10:26:03]
└─[0] <> ethtool enp10s0f1
Settings for enp10s0f1:
	Supported ports: [ TP ]
	Supported link modes:   100baseT/Full
	                        1000baseT/Full
	                        10000baseT/Full
	Supported pause frame use: No
	Supports auto-negotiation: Yes
	Advertised link modes:  100baseT/Full
	                        1000baseT/Full
	                        10000baseT/Full
	Advertised pause frame use: No
	Advertised auto-negotiation: Yes
	Speed: 10000Mb/s
	Duplex: Full
	Port: Twisted Pair
	PHYAD: 0
	Transceiver: external
	Auto-negotiation: on
	MDI-X: Unknown
Cannot get wake-on-lan settings: Operation not permitted
	Current message level: 0x00000007 (7)
			       drv probe link
	Link detected: yes
┌─[elatov@air] - [/home/elatov] - [2016-01-03 10:27:10]
└─[0] <> ethtool -i enp10s0f1
driver: ixgbe
version: 4.0.1-k
firmware-version: 0x80000518
expansion-rom-version:
bus-info: 0000:0a:00.1
supports-statistics: yes
supports-test: yes
supports-eeprom-access: yes
supports-register-dump: yes
supports-priv-flags: no
So I assigned an IP to the Linux Machine:
sudo ifconfig enp10s0f1 10.1.0.5 netmask 255.255.255.0 up
Doing an iperf test with parallel threads I was able to get same BW:
┌─[elatov@air] - [/home/elatov] - [2016-01-03 10:34:23]
└─[0] <> iperf -c 10.1.0.3 -w 2m -t 15 -P 2
------------------------------------------------------------
Client connecting to 10.1.0.3, TCP port 5001
TCP window size:  416 KByte (WARNING: requested 2.00 MByte)
------------------------------------------------------------
[  3] local 10.1.0.5 port 42992 connected with 10.1.0.3 port 5001
[  4] local 10.1.0.5 port 42994 connected with 10.1.0.3 port 5001
[ ID] Interval       Transfer     Bandwidth
[  3]  0.0-15.0 sec  6.59 GBytes  3.78 Gbits/sec
[  4]  0.0-15.0 sec  6.60 GBytes  3.78 Gbits/sec
[SUM]  0.0-15.0 sec  13.2 GBytes  7.56 Gbits/sec
Enabled Jumbo frames (as described in How to configure Jumbo Frames on a server):
┌─[elatov@air] - [/home/elatov] - [2016-01-03 10:50:52]
└─[0] <> sudo ip link set enp10s0f1 mtu 9000
Then confirmed they are working:
┌─[elatov@air] - [/home/elatov] - [2016-01-03 10:52:23]
└─[0] <> ping -s 9000 10.1.0.3
PING 10.1.0.3 (10.1.0.3) 9000(9028) bytes of data.
9008 bytes from 10.1.0.3: icmp_seq=2 ttl=255 time=0.575 ms
9008 bytes from 10.1.0.3: icmp_seq=3 ttl=255 time=0.240 ms
9008 bytes from 10.1.0.3: icmp_seq=4 ttl=255 time=0.264 ms
^C
--- 10.1.0.3 ping statistics ---
4 packets transmitted, 3 received, 25% packet loss, time 3008ms
rtt min/avg/max/mdev = 0.240/0.359/0.575/0.154 ms
But the iperf test were the same.
OmniOS Networking Setting Changes
As I was reading over Improving VM to VM network throughput on an ESXi platform I decided to increase some TCP parameters:
ndd -set /dev/ip ip_lso_outbound 0
ipadm set-prop -p max_buf=4194304 tcp
ipadm set-prop -p recv_buf=1048576 tcp
ipadm set-prop -p send_buf=1048576 tcp
I saw a couple of other suggestions from Solaris TCP Performance Tuning, but they didn’t apply to OmmiOS. I also ran into a pretty good site which had a lot of suggestions to try out when testing 10Gb: How do I troubleshoot slow Myri10GE performance?.
Enable flow control on OmniOS
It seems like with 10Gb network flow control is a good idea, so let’s enable that:
dladm set-linkprop -t -p flowctrl=bi ixgbe0
Here were the results with flow control and jumbo frames:
┌─[elatov@air] - [/home/elatov] - [2016-01-03 11:33:32]
└─[1] <> iperf -c 10.1.0.3 -m -w 2m
------------------------------------------------------------
Client connecting to 10.1.0.3, TCP port 5001
TCP window size:  416 KByte (WARNING: requested 2.00 MByte)
------------------------------------------------------------
[  3] local 10.1.0.5 port 43882 connected with 10.1.0.3 port 5001
[ ID] Interval       Transfer     Bandwidth
[  3]  0.0-10.0 sec  9.18 GBytes  7.89 Gbits/sec
[  3] MSS size 8948 bytes (MTU 8988 bytes, unknown interface)
I ran into an interesting issue where the Nic wouldn’t come up if flow-control is enabled during boot. So I actually ended up disabling that for long term:
dladm set-linkprop -p flowctrl=no ixgbe0
Disable intr_throttling for ixgbe driver on OmniOS
Then I ran into Low latency networking and they mentioned disabling intr_polling helped out. So I first set that on the fly:
ndd -set /dev/ixgbe0 intr_throttling 1
Then I also wanted to try out netperf instead of iperf. Luckily the latest version of OmniOS has netperf in the repository:
┌─[root@zfs] - [/root] - [2016-01-10 12:54:05]
└─[0] <> pkg search netperf
INDEX       ACTION VALUE                              PACKAGE
basename    file   usr/bin/netperf                    pkg:/network/test/netperf@2.7.0-0.151016
pkg.descr   set    netperf network testing tool 2.7.0 pkg:/network/test/netperf@2.7.0-0.151016
pkg.fmri    set    omnios/network/test/netperf        pkg:/network/test/netperf@2.7.0-0.151016
pkg.summary set    netperf network testing tool       pkg:/network/test/netperf@2.7.0-0.151016
So after disabling intr_polling, I saw the following:
┌─[elatov@air] - [/home/elatov] - [2016-01-03 03:55:00]
└─[0] <> netperf -H 10.1.0.3 -t TCP_STREAM -C -c -l 60  -- -s 512K -S 512K
MIGRATED TCP STREAM TEST from 0.0.0.0 (0.0.0.0) port 0 AF_INET to 10.1.0.3 () port 0 AF_INET : demo
Recv   Send    Send                          Utilization       Service Demand
Socket Socket  Message  Elapsed              Send     Recv     Send    Recv
Size   Size    Size     Time     Throughput  local    remote   local   remote
bytes  bytes   bytes    secs.    10^6bits/s  % S      % M      us/KB   us/KB

524744 425984 425984    60.00      8114.30   4.48     31.14    0.181   1.257
I was able to get about 8Gb/s. To permanently disable intr_throttling we can add the following:
┌─[root@zfs] - [/root] - [2016-01-10 12:57:21]
└─[0] <> tail -1 /kernel/drv/ixgbe.conf
intr_throttling=1;
And after a reboot it should be applied.
Thunderbolt 8Gb/s throughput
After trying different things, I couldn’t get above the 8Gb/s limitation. I started doing some research and I saw that other people saw the same limitation with thunderbolt:
- What you need to know about Thunderbolt
- Promise Pegasus R6 & Mac Thunderbolt Review
- Theoretical vs. Actual Bandwidth: PCI Express and Thunderbolt
Some notes from the above sites:
So how much performance can you actually wring out of a Thunderbolt connection?
Gordon Ung at Maximum PC saw peak read transfer speeds of 931MB/s when reading from a RAID 0 of four 240GB SandForce SF-2281 SSDs in a Pegasus R4 chassis.
AnandTech actually got an SSD RAID in a Pegasus chassis right up to 1002MB/s at its very peak, which seems to be right up at the practical limit of a single Thunderbolt channel, but that was using a RAID 0 of four 128GB 6Gbps SATA SSDs, running sustained 2MB reads at a queue depth of 10.
1002MB/s is about the same as 8Gbits/s and here is more:
How fast is it really?
In theory, it’s blazing fast. A Thunderbolt channel can provide up to 10 Gigabits per second (Gbps) of data throughput—and each Thunderbolt port includes two channels. Thunderbolt is also bi-directional, meaning it can transmit and receive data at the same time. Even with estimated real-world performance of around 8Gbps, Thunderbolt is many times faster than FireWire 800 and USB 3.0. It’s also significantly faster than the eSATA connections available on many Windows PCs.
And lastly:
With highly compressible data, I managed to get just over 1000MB/s (8021Mbps to be exact) to the 4-drive SF-2281 Pegasus R6. Note that this isn’t a shipping configuration, but it does show us the limits of the platform. I’m not entirely convinced that we’re limited by Thunderbolt here either - it could very well be the Pegasus’ internal controller that’s limiting performance. Until we get some other Thunderbolt RAID devices in house it’s impossible to tell but at around 8Gbps, this is clearly an interface that has legs.
It’s still really fast and I am glad to know the limit.
ESXi Iperf Test
I then gave it a try to see if I can get some results from the mac-mini. After I plugged the thunderbolt into the converter and reboted I saw both ports picked up by the driver:
[root@macm:~] esxcli network nic list
Name    PCI Device    Driver  Admin Status  Link Status  Speed  Duplex  MAC Address         MTU  Description
------  ------------  ------  ------------  -----------  -----  ------  -----------------  ----  ---------------------------------------------------------
vmnic0  0000:01:00.0  tg3     Up            Up            1000  Full    68:5b:35:c9:96:10  1500  Broadcom Corporation NetXtreme BCM57766 Gigabit Ethernet
vmnic1  0000:09:00.0  ixgbe   Up            Up           10000  Full    00:30:93:0c:05:c6  9000  Intel Corporation Ethernet Controller 10 Gigabit X540-AT2
vmnic2  0000:09:00.1  ixgbe   Up            Up           10000  Full    00:30:93:0c:05:c7  9000  Intel Corporation Ethernet Controller 10 Gigabit X540-AT2
I also found out that iperf is now part of the install, so I ran a quick test:
[root@macm:~] /usr/lib/vmware/vsan/bin/iperf -c 10.1.0.3 -m -w 2m -P 4
------------------------------------------------------------
Client connecting to 10.1.0.3, TCP port 5001
TCP window size: 2.01 MByte (WARNING: requested 2.00 MByte)
------------------------------------------------------------
[  6] local 10.1.0.10 port 14778 connected with 10.1.0.3 port 5001
[  4] local 10.1.0.10 port 40464 connected with 10.1.0.3 port 5001
[  5] local 10.1.0.10 port 41775 connected with 10.1.0.3 port 5001
[  3] local 10.1.0.10 port 51394 connected with 10.1.0.3 port 5001
[ ID] Interval       Transfer     Bandwidth
[  6]  0.0-10.0 sec  2.10 GBytes  1.81 Gbits/sec
[  6] MSS size 8948 bytes (MTU 8988 bytes, unknown interface)
[  4]  0.0-10.0 sec  2.10 GBytes  1.81 Gbits/sec
[  4] MSS size 8948 bytes (MTU 8988 bytes, unknown interface)
[  5]  0.0-10.0 sec  2.11 GBytes  1.81 Gbits/sec
[  5] MSS size 8948 bytes (MTU 8988 bytes, unknown interface)
[  3]  0.0-10.0 sec  2.11 GBytes  1.81 Gbits/sec
[  3] MSS size 8948 bytes (MTU 8988 bytes, unknown interface)
[SUM]  0.0-10.0 sec  8.43 GBytes  7.24 Gbits/sec
It about at 7.2Gb/s .
Installing External Iperf Binary on ESXi 6
If you don’t have iperf on your ESXi install you can grab it from here. The install instructions are here, you can just run the following (after you copied the VIB to the ESXi machine):
esxcli software vib install -v /tmp/iperf-2.0.5-1.x86_64.vib --no-sig-check
Then you will see it under /opt/iperf/bin/iperf:
[root@macm:~] /opt/iperf/bin/iperf -v
iperf version 2.0.5 (08 Jul 2010) pthreads
The site mentions that ESXi 6 is not tested, but it worked out okay for me.
Changing ixgbe Driver and TCP VMkernel Options on ESXi
I tried disabling LRO and setting Interrupt Mode to legacy:
[root@macm:~] esxcli system module parameters set --module ixgbe -p "LRO=0"
[root@macm:~] esxcli system module parameters list --module ixgbe | grep -E 'LRO|^Name'
Name                   Type          Value  Description
LRO                    array of int  0      Large Receive Offload (0,1), default 1 = on
And here is the Interrupt Mode:
[root@macm:~] esxcli system module parameters set --module ixgbe -p "IntMode=0"
[root@macm:~] esxcli system module parameters list --module ixgbe | grep -E '^IntMode|^Name'
Name                   Type          Value  Description
IntMode                array of int  0      Change Interrupt Mode (0=Legacy, 1=MSI, 2=MSI-X), default 2
But that didn’t make a difference in the iperf results. Also disabled it at the vmekrnel level:
[root@macm:~] esxcli system settings advanced set -o /Net/TcpipDefLROEnabled -i 0
[root@macm:~] esxcli system settings advanced list -o /Net/TcpipDefLROEnabled
   Path: /Net/TcpipDefLROEnabled
   Type: integer
   Int Value: 0
   Default Int Value: 1
   Min Value: 0
   Max Value: 1
   String Value:
   Default String Value:
   Valid Characters:
   Description: LRO enabled for TCP/IP
But that still didn’t help. Lastly tried to disable TSO:
[root@macm:~] esxcli system settings advanced set -o /Net/UseHwTSO -i 0
[root@macm:~] esxcli system settings advanced list -o /Net/UseHwTSO
   Path: /Net/UseHwTSO
   Type: integer
   Int Value: 0
   Default Int Value: 1
   Min Value: 0
   Max Value: 1
   String Value:
   Default String Value:
   Valid Characters:
   Description: When non-zero, use pNIC HW TSO offload if available
and that didn’t help either. The highest BW on the ESXi host I got was 7Gb/s. Even tried enabling IPv4 TSO on the Nics:
[root@macm:~] esxcli network nic software set --ipv4tso=1 -n vmnic1
[root@macm:~] esxcli network nic software set --ipv4tso=1 -n vmnic2
[root@macm:~] esxcli network nic software list
NIC     IPv4 CSO  IPv4 TSO  Scatter Gather  Offset Based Offload  VXLAN Encap  Geneve Offload  IPv6 TSO  IPv6 TSO Ext  IPv6 CSO  IPv6 CSO Ext  High DMA  Scatter Gather MP  VLAN Tagging  VLAN Untagging
------  --------  --------  --------------  --------------------  -----------  --------------  --------  ------------  --------  ------------  --------  -----------------  ------------  --------------
vmnic0  off       on        off             off                   off          off             off       off           off       off           off       off                off           off
vmnic1  off       on        off             off                   off          off             off       off           off       off           off       off                off           off
vmnic2  off       on        off             off                   off          off             off       off           off       off           off       off                off           off
But still no benefit.
SSD ZFS Zpool on Storage Box
I ended up creating a raid0 zpool from my two SSD drives that were used for cache and logs in my data zpool. This was just to make sure I get the most from the zpool.
┌─[root@zfs] - [/root] - [2016-01-10 01:21:00]
└─[0] <> zpool status -v ssd
  pool: ssd
 state: ONLINE
  scan: none requested
config:

        NAME        STATE     READ WRITE CKSUM
        ssd         ONLINE       0     0     0
          c2t0d0    ONLINE       0     0     0
          c2t1d0    ONLINE       0     0     0

errors: No known data errors
Both drives are the same SSDs:
┌─[root@zfs] - [/root] - [2016-01-10 01:24:14]
└─[127] <> cfgadm -al -s "select=type(disk),cols=ap_id:info" sata1/0::dsk/c2t0d0
Ap_Id                          Information
sata1/0::dsk/c2t0d0            Mod: Samsung SSD 840 EVO 250GB FRev: EXT0BB6Q SN: XXXX
Doing a bonnie++ test from the netapp-it console, I saw the following results (it’s the ssd zpool):
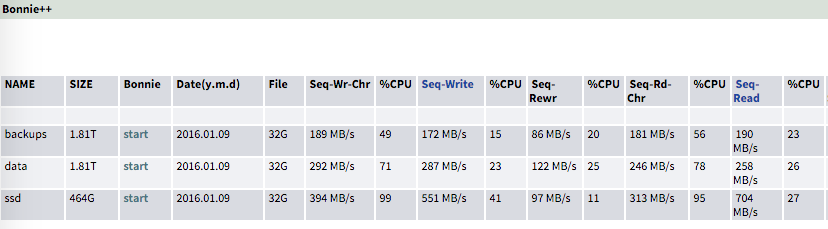
I also did other benchmarks in my previous post. It looks like we can do 550MB/s Write and 700MB/s Read (both sequential).
Initial IOmeter Testing
I did the same thing that I did here for my benchmark tests. Initially the results looked like this:
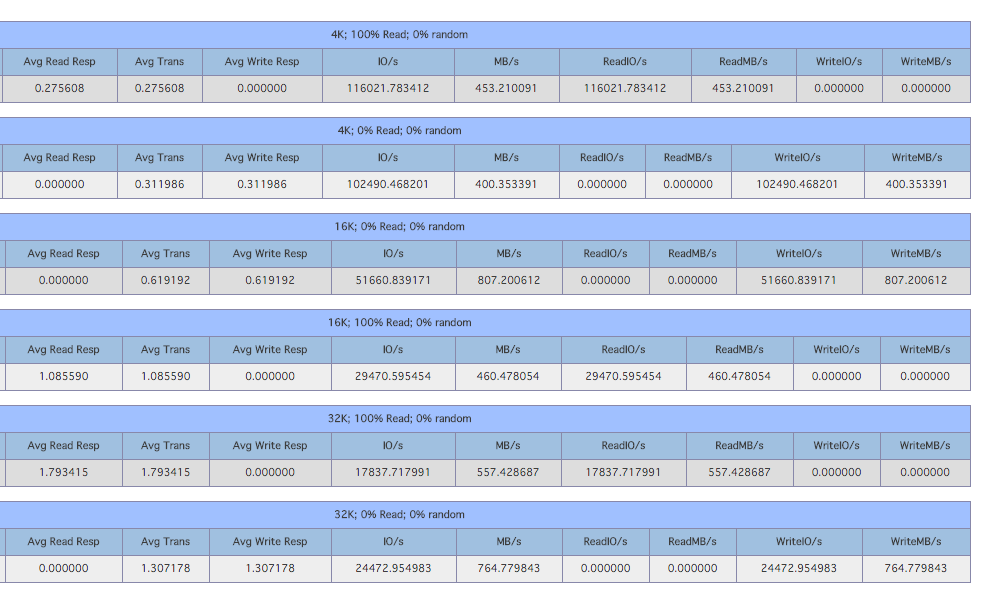
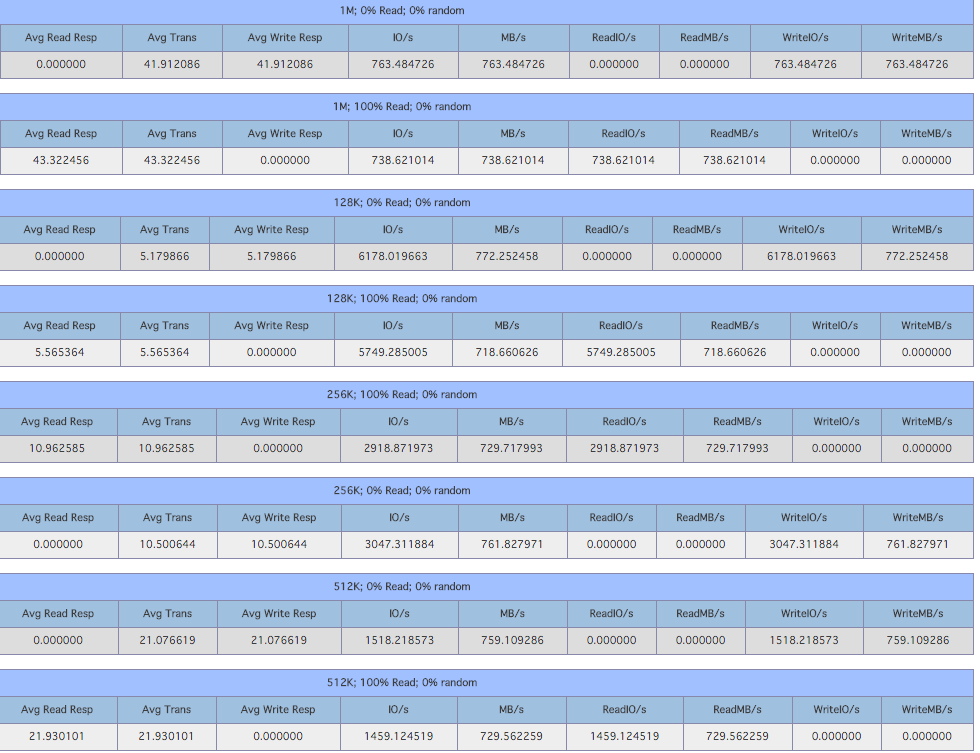
And here is a similar test for bigger IO:
While the test was going, I checked out the Nic Utilization on the OmniOS machine and I saw the following:
┌─[root@zfs] - [/root] - [2016-01-09 09:38:30]
└─[0] <> /var/web-gui/data_last/tools/nicstat/nicstat -M -i ixgbe0 1
    Time      Int   rMbps   wMbps   rPk/s   wPk/s    rAvs    wAvs %Util    Sat
09:38:32   ixgbe0    0.00    0.00    0.06    0.04  3209.1   701.5  0.00   0.00
09:38:33   ixgbe0  4452.6   30.03 65822.6 46772.0  8866.4   84.15  46.7   0.00
09:38:34   ixgbe0  5930.6   39.35 86300.8 61054.4  9007.3   84.49  62.2   0.00
09:38:35   ixgbe0  6280.4   41.69 91414.3 64683.4  9005.0   84.48  65.9   0.00
09:38:36   ixgbe0  6345.0   42.16 92388.5 65413.3  9001.7   84.49  66.5   0.00
09:38:37   ixgbe0  6135.4   40.72 89383.0 63171.0  8997.1   84.48  64.3   0.00
09:38:38   ixgbe0  4924.7   33.01 72629.9 51337.1  8887.5   84.29  51.6   0.00
09:38:39   ixgbe0  6347.3   42.14 92361.6 65384.3  9007.6   84.48  66.6   0.00
It’s going at ~6.5Gb/s.
ESXi iSCSI Settings Modification
From the above results small IO didn’t do too well and some times Writes were way faster than Reads.
Disable Delayed Ack (Nagle Algorithm) on ESXi
So the first thing I tried was to disable Delay Acks for the iSCSI stack on the ESXi server. From this VMware KB:
Some iSCSI storage arrays from different array vendors do not behave appropriately during periods of network congestion. This problem is related to the TCP/IP implementation of these arrays and can severely impact the read performance of storage attached to the ESXi/ESX software through the iSCSI initiator.
So I disabled that with the following command:
vmkiscsi-tool -W -a delayed_ack=0 -j vmhba37
You can confirm the setting by running the following:
[root@macm:~] vmkiscsi-tool -W vmhba37 | grep -E 'delayed_ack|^Parameter'
Parameter          Min/List      Max         Current         Settable
delayed_ack        OFF           N/A         OFF             Yes
Just in case I rebooted the ESXi host. The read performance did get a little better.
Enable MPIO (MultiPath IO) for iSCSI on ESXi
Since the converter had two 10Gb Nics, I decided to set up iSCSI MPIO with port binding. These sites cover most of the configuration:
- vSphere 5.0 Storage Features Part 12 – iSCSI Multipathing Enhancements
- Multipathing Configuration for Software iSCSI Using Port Binding
- Considerations for using software iSCSI port binding in ESX/ESXi
After I was done I saw multiple paths going to the same LUN:
[root@macm:~] esxcli storage nmp path list -d naa.600144f009d4d236000056918f920002 | grep ^iq
n -A 1
iqn.1998-01.com.vmware:macm-38de68076-00023d000003,iqn.2010-09.org.napp-it:zfs,t,1-naa.600144f009d4d236000056918f920002
   Runtime Name: vmhba37:C1:T0:L4
--
iqn.1998-01.com.vmware:macm-38de68076-00023d000001,iqn.2010-09.org.napp-it:zfs,t,1-naa.600144f009d4d236000056918f920002
   Runtime Name: vmhba37:C0:T0:L4
Change Path Policy from MRU (Most Recently Used) to RR (Round Robin) for OmniOS Luns
By default only one path will be used for active IO, so let’s change that. First figure out the available PSPs:
[root@macm:~] esxcli storage nmp satp list
Name                 Default PSP    Description
-------------------  -------------  -------------------------------------------------------
VMW_SATP_ALUA        VMW_PSP_MRU    Supports non-specific arrays that use the ALUA protocol
VMW_SATP_MSA         VMW_PSP_MRU    Placeholder (plugin not loaded)
VMW_SATP_DEFAULT_AP  VMW_PSP_MRU    Placeholder (plugin not loaded)
VMW_SATP_SVC         VMW_PSP_FIXED  Placeholder (plugin not loaded)
VMW_SATP_EQL         VMW_PSP_FIXED  Placeholder (plugin not loaded)
VMW_SATP_INV         VMW_PSP_FIXED  Placeholder (plugin not loaded)
VMW_SATP_EVA         VMW_PSP_FIXED  Placeholder (plugin not loaded)
VMW_SATP_ALUA_CX     VMW_PSP_RR     Placeholder (plugin not loaded)
VMW_SATP_SYMM        VMW_PSP_RR     Placeholder (plugin not loaded)
VMW_SATP_CX          VMW_PSP_MRU    Placeholder (plugin not loaded)
VMW_SATP_LSI         VMW_PSP_MRU    Placeholder (plugin not loaded)
VMW_SATP_DEFAULT_AA  VMW_PSP_FIXED  Supports non-specific active/active arrays
VMW_SATP_LOCAL       VMW_PSP_FIXED  Supports direct attached devices
Then check what the current one is set to:
[root@macm:~] esxcli  storage nmp device list -d naa.600144f009d4d236000056918f920002
naa.600144f009d4d236000056918f920002
   Device Display Name: SUN iSCSI Disk (naa.600144f009d4d236000056918f920002)
   Storage Array Type: VMW_SATP_ALUA
   Storage Array Type Device Config: {implicit_support=on;explicit_support=off; explicit_allow=on;alua_followover=on; action_OnRetryErrors=off; {TPG_id=0,TPG_state=AO}}
   Path Selection Policy: VMW_PSP_MRU
   Path Selection Policy Device Config: Current Path=vmhba37:C0:T0:L4
   Path Selection Policy Device Custom Config:
   Working Paths: vmhba37:C0:T0:L4
   Is USB: false
You will notice the default it’s MRU (Path Selection Policy: VMW_PSP_MRU). If we want to use both paths at the same time we can enable RR (Round Robin):
[root@macm:~] esxcli storage nmp device set -d naa.600144f009d4d236000056918f920002 -P VMW_PSP_RR
[root@macm:~] esxcli  storage nmp device list -d naa.600144f009d4d236000056918f920002
naa.600144f009d4d236000056918f920002
   Device Display Name: SUN iSCSI Disk (naa.600144f009d4d236000056918f920002)
   Storage Array Type: VMW_SATP_ALUA
   Storage Array Type Device Config: {implicit_support=on;explicit_support=off; explicit_allow=on;alua_followover=on; action_OnRetryErrors=off; {TPG_id=0,TPG_state=AO}}
   Path Selection Policy: VMW_PSP_RR
   Path Selection Policy Device Config: {policy=rr,iops=1000,bytes=10485760,useANO=0; lastPathIndex=1: NumIOsPending=0,numBytesPending=0}
   Path Selection Policy Device Custom Config:
   Working Paths: vmhba37:C1:T0:L4, vmhba37:C0:T0:L4
   Is USB: false
You will also notice that the Round Robin occurs after 1000 iops as per and it’s recommended to change that to 1. Couple of Links:
- Best Practices for VMware vSphere with NexentaStor
- Adjusting Round Robin IOPS limit from default 1000 to 1
From the VMware KB:
Adjusting the limit can provide a positive impact to performance and is recommended by other storage vendors to change IOPS limit to 1. For example, the default of 1000 input/output operations per second (IOPS) sends 1000 I/O down each path before switching. If the load is such that a portion of the 1000 IOPS can saturate the bandwidth of the path, the remaining I/O must wait even if the storage array could service the requests. The IOPS or bytes limit can be adjusted downward allowing the path to be switched at a more frequent rate. The adjustment allows the bandwidth of additional paths to be used while the other path is currently saturated.
We can change that to 1, first confirm the setting:
[root@macm:~] esxcli storage nmp psp roundrobin deviceconfig get -d naa.600144f009d4d236000056918f920002
   Byte Limit: 10485760
   Device: naa.600144f009d4d236000056918f920002
   IOOperation Limit: 1000
   Limit Type: Default
   Use Active Unoptimized Paths: false
Then to change it you can do the following:
[root@macm:~] esxcli storage nmp psp roundrobin deviceconfig set -d naa.600144f009d4d236000056918f920002 -I 1 -t iops
[root@macm:~] esxcli storage nmp psp roundrobin deviceconfig get -d naa.600144f009d4d236000056918f920002
   Byte Limit: 10485760
   Device: naa.600144f009d4d236000056918f920002
   IOOperation Limit: 1
   Limit Type: Iops
   Use Active Unoptimized Paths: false
Create SATP Rule to Change Path Policy by Default
The above settings are done on the fly and after reboot will go away. If we want to make it permanent, we can create a new SATP rule to match on our vendor and model and assign it to our custom SATP. To figure out what our model and vendor settings are for a LUN, just run the following:
[root@macm:~] esxcli storage core device list -d naa.600144f009d4d236000056918f920002 | head
naa.600144f009d4d236000056918f920002
   Display Name: SUN iSCSI Disk (naa.600144f009d4d236000056918f920002)
   Has Settable Display Name: true
   Size: 307200
   Device Type: Direct-Access
   Multipath Plugin: NMP
   Devfs Path: /vmfs/devices/disks/naa.600144f009d4d236000056918f920002
   Vendor: SUN
   Model: COMSTAR
   Revision: 1.0
In my case Vendor is SUN and Model is COMSTAR. Now to create our SATP rule:
[root@macm:~] esxcli storage nmp satp rule add -V SUN -M COMSTAR -P VMW_PSP_RR -s VMW_SATP_ALUA -e "OmniOS Devices" -O "iops=1"
And then we can confirm the rule is there:
[root@macm:~] esxcli storage nmp satp rule list | grep -E '^Name|OmniOS'
Name           Device  Vendor   Model  Driver  Transport  Options Rule Group  Claim Options   Default PSP  PSP Options  Description
VMW_SATP_ALUA  		   SUN      COMSTAR                           user                        VMW_PSP_RR   iops=1       OmniOS Devices
Now let’s shutdown all the VMs (if auto start is configured):
[root@macm:~] vmware-autostart.sh stop
Next let’s put the host in maintance mode
[root@macm:~] esxcli system maintenanceMode set -e true
And finally reboot
[root@macm:~] esxcli system shutdown reboot -r "RR"
Then after the reboot make sure all the LUN options are set apppropriately:
[root@macm:~] for disk in $(esxcli  storage nmp device list | grep SUN -B 1 | grep ^naa); do echo ""; esxcli storage nmp psp roundrobin deviceconfig get -d $disk; done

   Byte Limit: 10485760
   Device: naa.600144f009d4d2360000569169d20001
   IOOperation Limit: 1
   Limit Type: Iops
   Use Active Unoptimized Paths: false

   Byte Limit: 10485760
   Device: naa.600144f009d4d23600005588ed0e0002
   IOOperation Limit: 1
   Limit Type: Default
   Use Active Unoptimized Paths: false

   Byte Limit: 10485760
   Device: naa.600144f009d4d2360000564773790001
   IOOperation Limit: 1
   Limit Type: Default
   Use Active Unoptimized Paths: false

   Byte Limit: 10485760
   Device: naa.600144f009d4d236000056918f920002
   IOOperation Limit: 1
   Limit Type: Iops
   Use Active Unoptimized Paths: false
Final IOmeter Results
After all of the above settings here were the results:
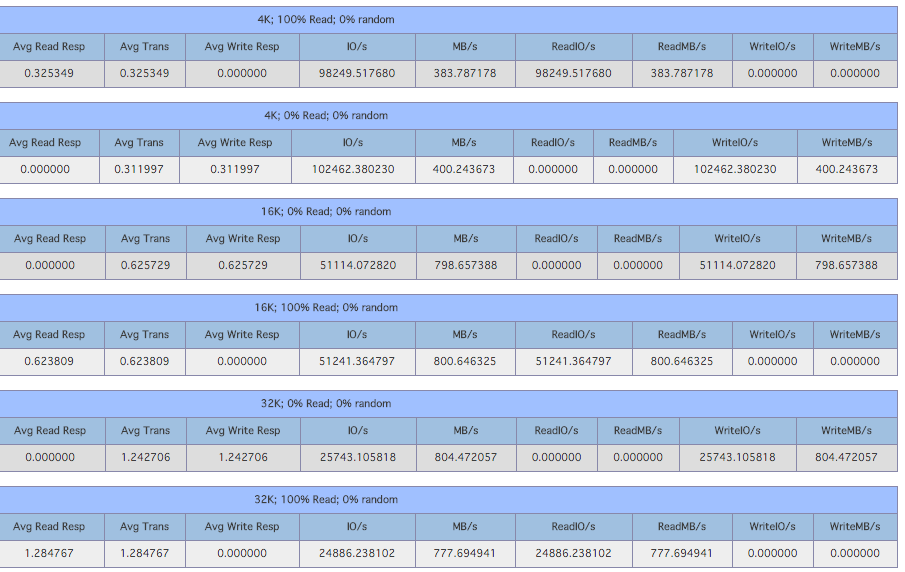
16K and 32K output went way up. And the bigger IO one:
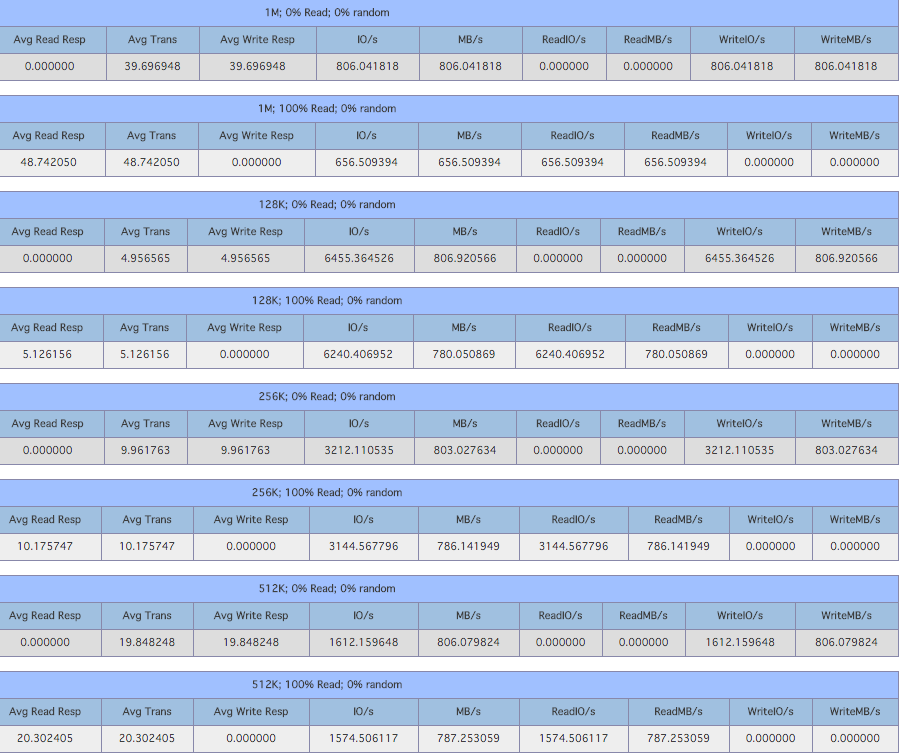
Most of the results increased except the 1M read. Getting 800MB/s (6.4Gb/s) write and read speed is pretty incredible. While I was running the test I saw the following in esxtop:
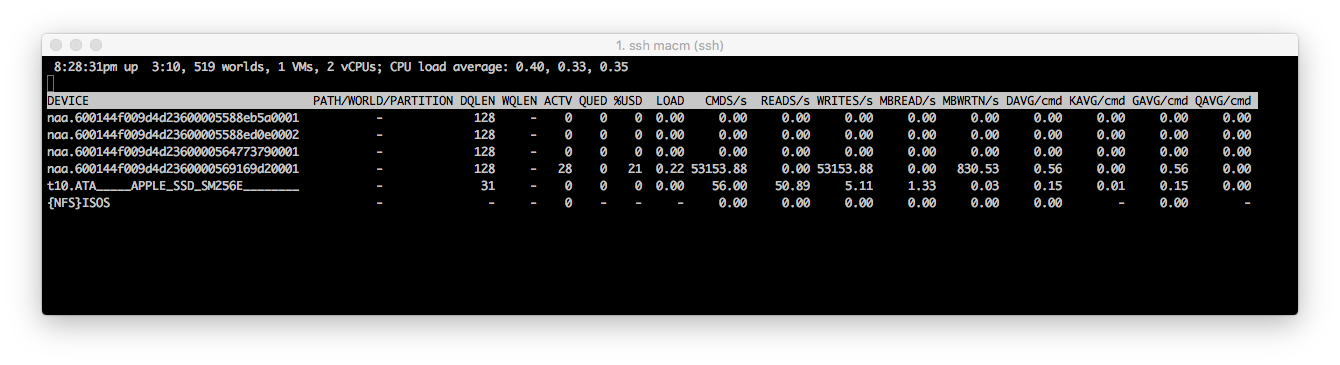
I love seeing high Write Speed and low DAVG :) And to confirm multipathing is working I saw the following on the Nics:
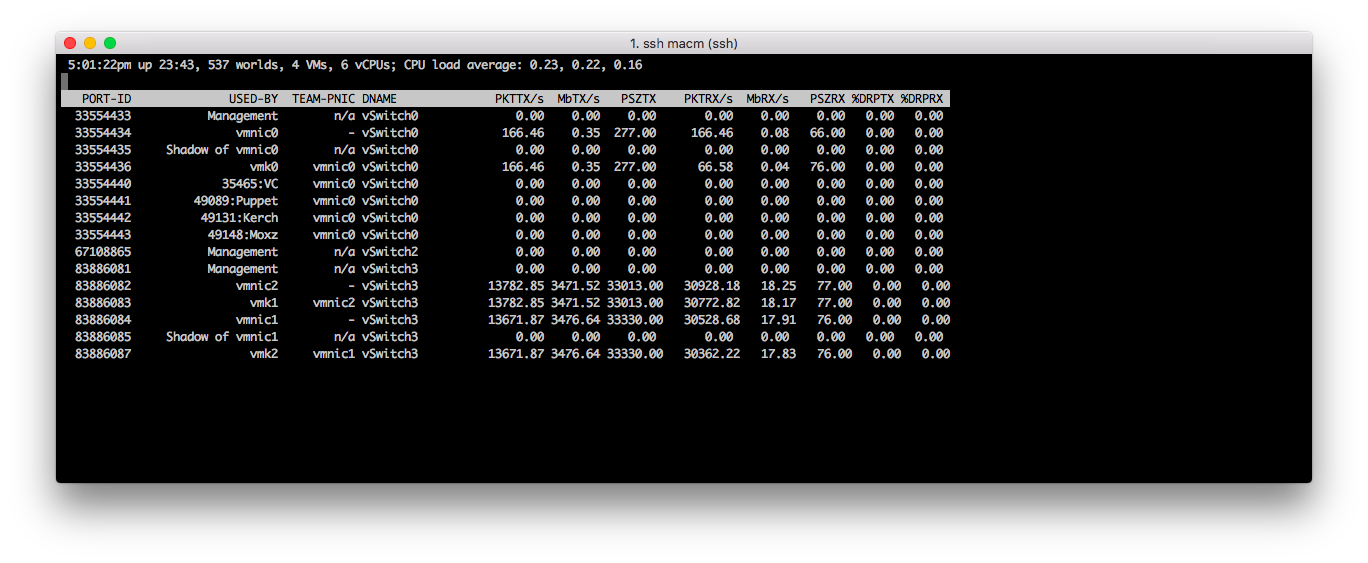
We can see the same amount of traffic going down both Nics. My guess is that the SSD write and read speeds are slowing down the test a little bit, but other than that I am pretty happy with the results. I want to get the next generation mac mini or Mac Pro (they have thunderbolt 2 ports vs Thunderbolt 1 and are advertised to handle 20Gb/s throughput) and see if the results change.