Setup Suricata on pfSense
After installing pfSense on the APU device I decided to setup suricata on it as well.
Install the Suricata Package
pfSense provides a UI for everything. So from the admin page go to System -> Package Manager -> Available Packages and search for suricata:
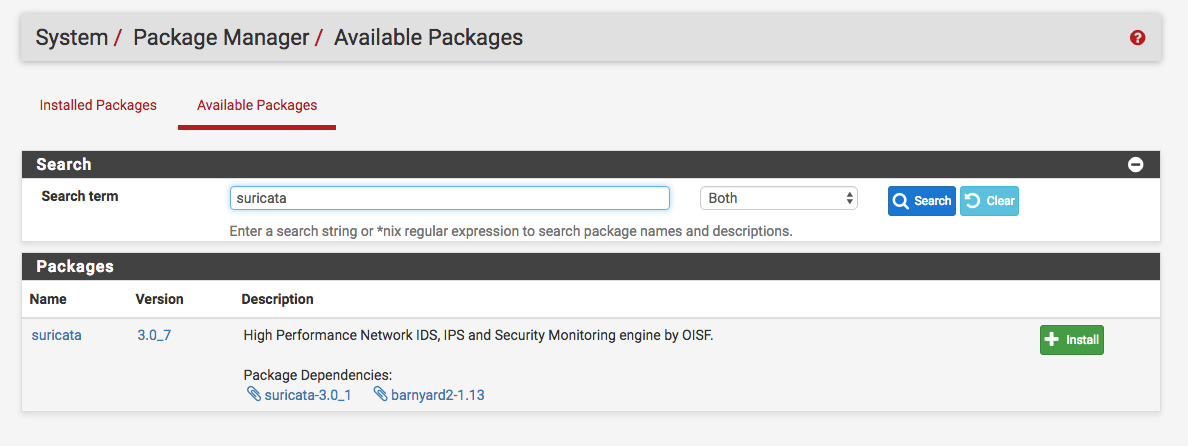
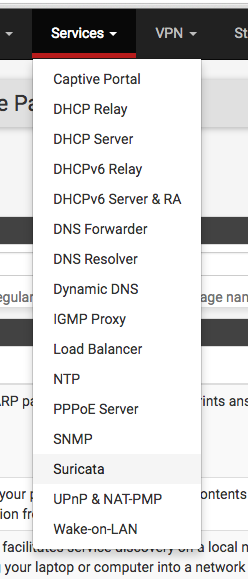
Then go ahead and install it. After that you will see it under the Services tab:
Enable Rule Download
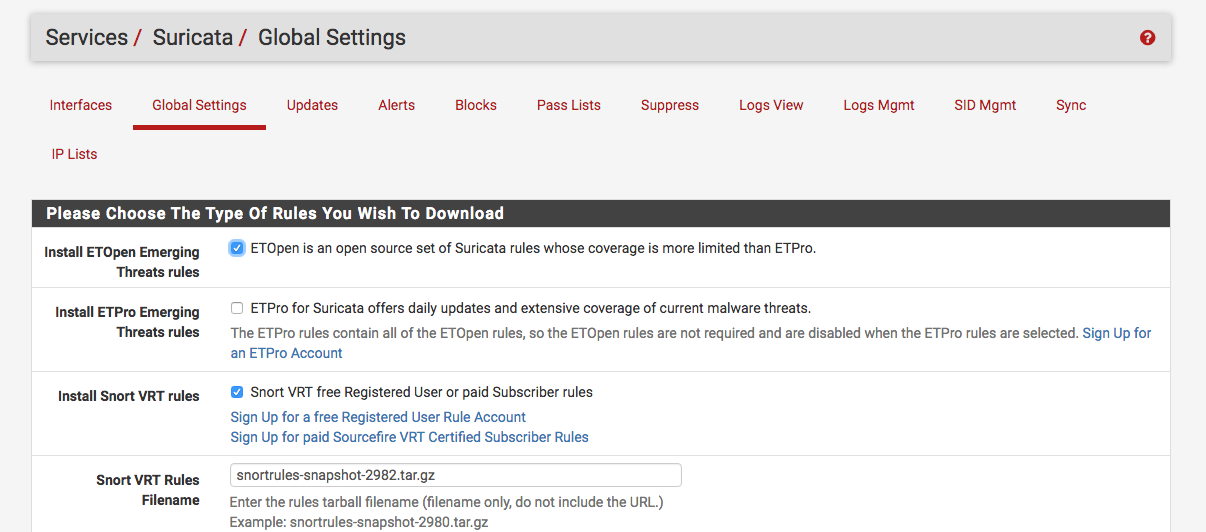
Under Services -> Suricata -> Global Settings you can enter settings to download Snort and ET rules:
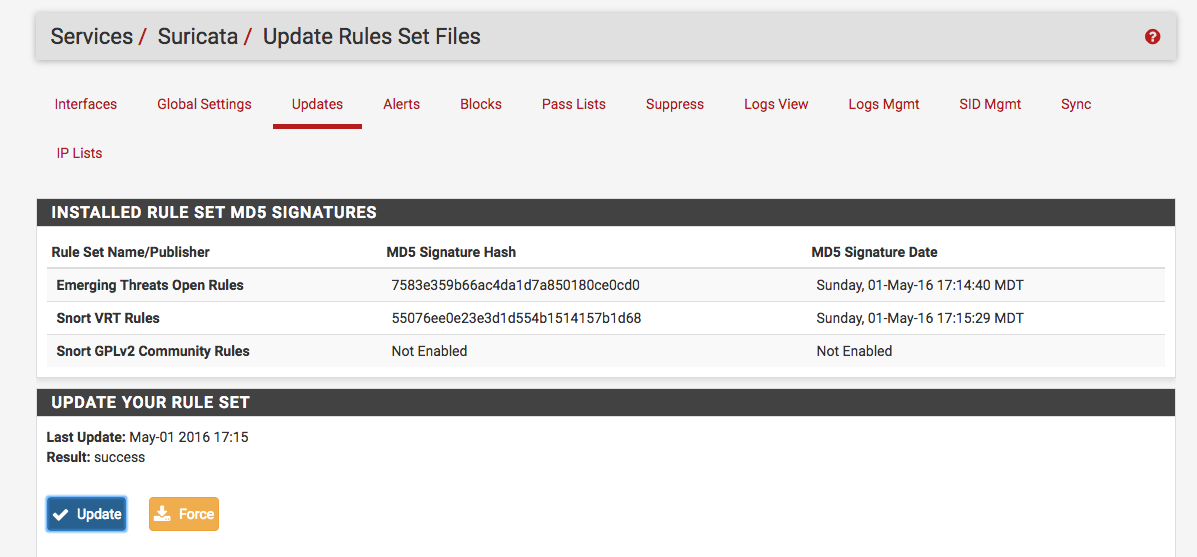
After adding the rules you can manually download them under Services -> Suricata -> Updates:
Create Lists
First I created a list which represented my home network under Services -> Suricata -> Pass List:

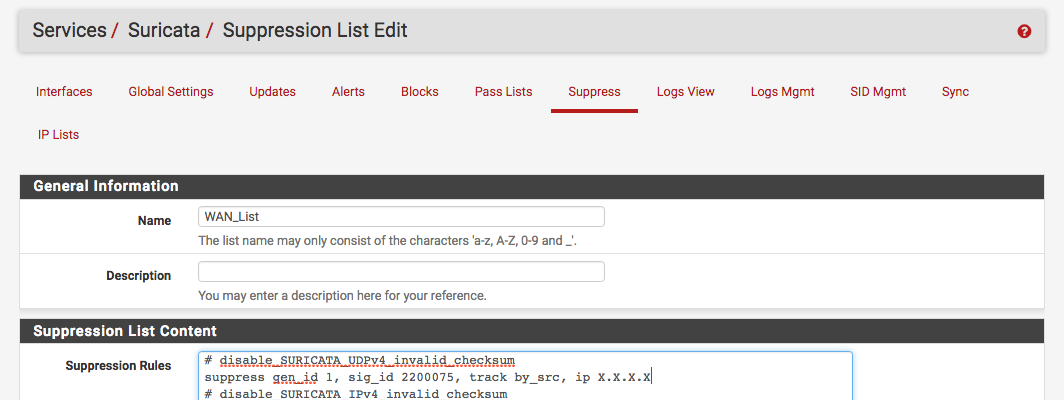
And I also created created a suppress list to suppress certain snort and ET signatures since initially there a bunch of False Positives. This is accomplished under Services -> Suricata -> Suppress:

Here are some of the signatures that I suppressed:
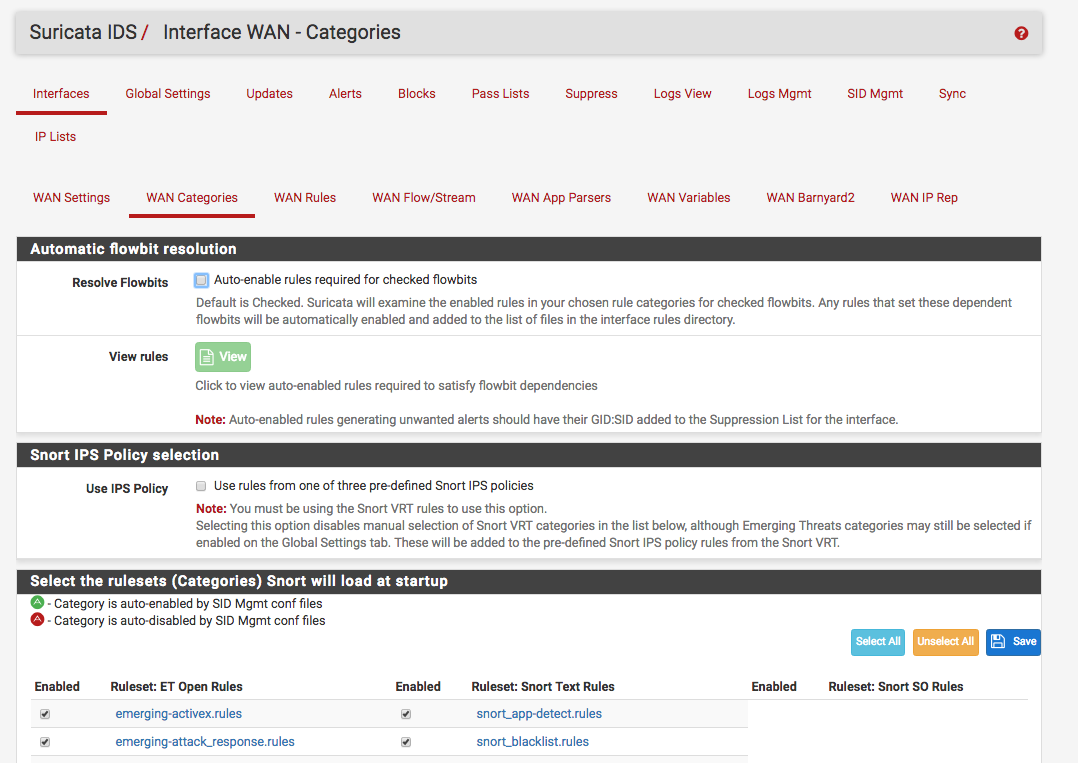
On top of the suppress list you can also choose what rule categories to enable under Services -> Suricata -> Interfaces -> WAN Categories:
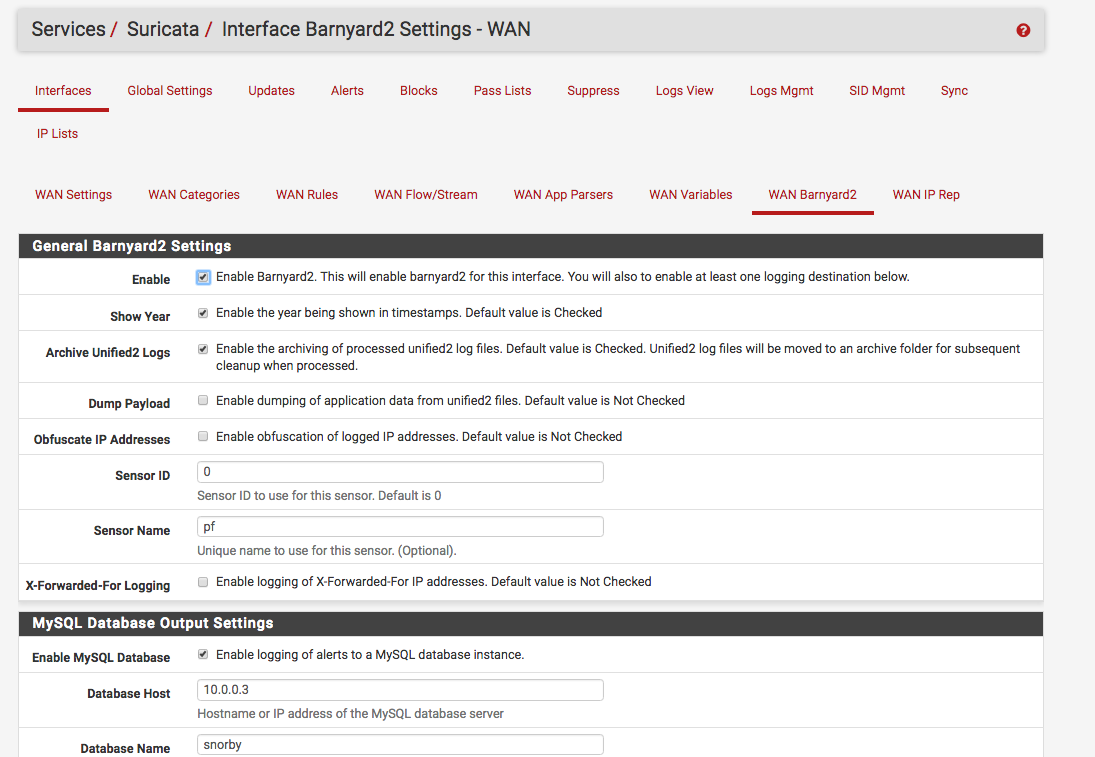
Enable Barnyard2
Since I already had a snorby setup (and this one), I decided to send the events to the snorby database. This is accomplished under Services -> Suricata -> Interface -> WAN Barnyard2:
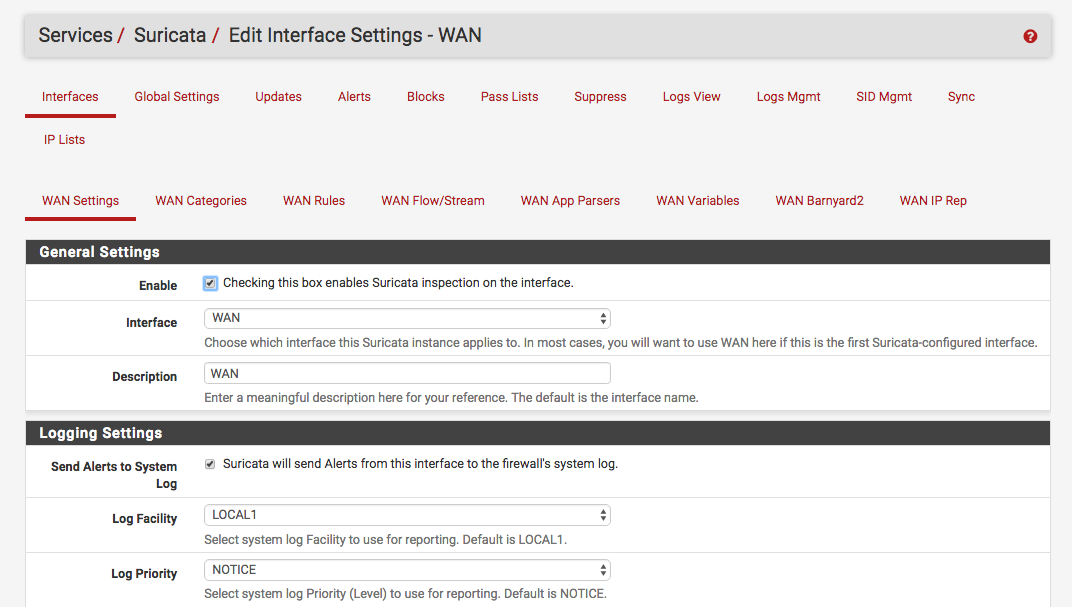
Configure Logging And Other Parameters
Now under the main config for the interface let’s enable it and setup logging. Under Servces -> Suricata -> Interface -> WAN settings I had the following:
And down below I enabled the lists that I had created before:

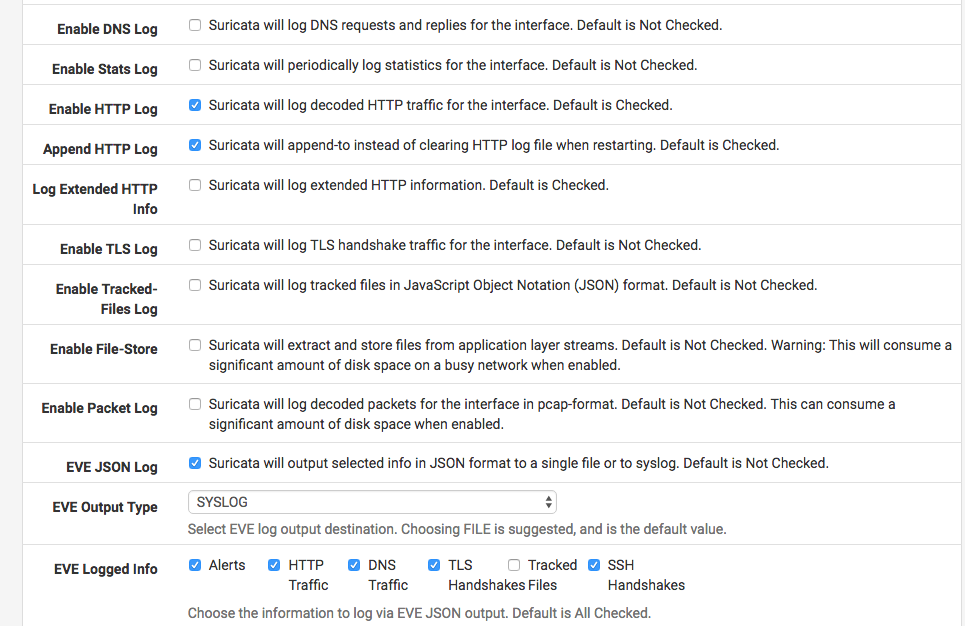
I also disabled the http extending logging along with tracked files since I was sending the logs over syslog and the JSON was getting truncated (this will help out later for the ELK setup):
Enable Watchdog
Another optional thing you can do is install Service Watchdog:

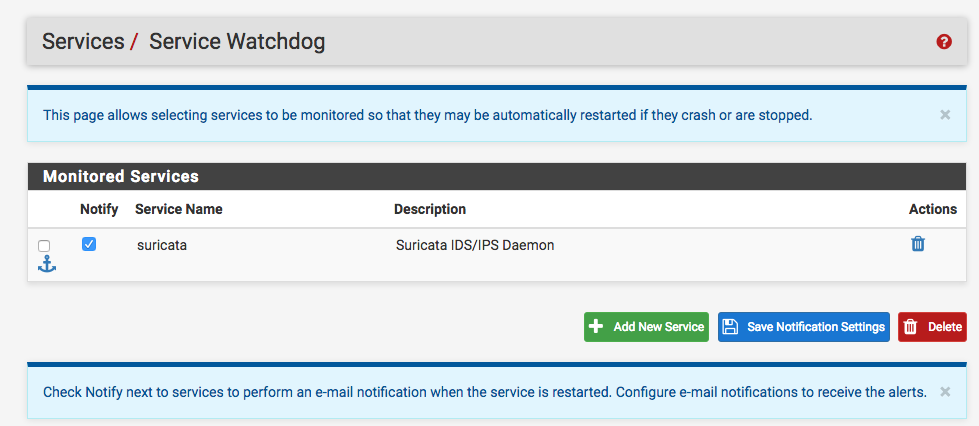
And under Services -> Service Watchdog enable it to monitor the Suricata Service:
Check Out the Config
You can ssh to the pfSense machine and check out all the settings. After it was initialized the machine was pretty idle:
[2.3-RELEASE][root@pf.kar.int]/root: top -CPz -o cpu -n
last pid: 69987;  load averages:  0.08,  0.06,  0.07  up 6+07:27:23    17:38:06
41 processes:  1 running, 40 sleeping

Mem: 299M Active, 484M Inact, 260M Wired, 383M Buf, 2870M Free
Swap: 4096M Total, 4096M Free


  PID USERNAME  THR PRI NICE   SIZE    RES STATE   C   TIME     CPU COMMAND
35582 root        7  20    0   696M   593M uwait   1   8:21   2.78% suricata
35368 root        1  20    0   134M 99440K nanslp  0  14:56   0.00% barnyard2
15529 root        1  20    0 16676K  2256K bpf     0   4:54   0.00% filterlog
22872 root        5  20    0 27300K  2448K accept  1   3:55   0.00% dpinger
46428 root        1  52   20 17000K  2564K wait    0   3:53   0.00% sh
37472 unbound     2  20    0 63304K 34280K kqread  1   3:06   0.00% unbound
It looks like it starts a suricata instance per interface:
[2.3-RELEASE][root@pf.kar.int]/root: ps auwwx | grep suricata
root    35582   2.9 14.7 713016 607712  -  Ss    2:36PM     8:24.77 /usr/local/bin/suricata -i re0 -D -c /usr/local/etc/suricata/suricata_34499_re0/suricata.yaml --pidfile /var/run/suricata_re034499.pid
root    35368   0.0  2.4 137684  99440  -  S     2:36PM    14:56.48 /usr/local/bin/barnyard2 -r 34499 -f unified2.alert --pid-path /var/run --nolock-pidfile -c /usr/local/etc/suricata/suricata_34499_re0/barnyard2.conf -d /var/log/suricata/suricata_re034499 -D -q
root    90667   0.0  0.1  18740   2252  0  S+    5:39PM     0:00.00 grep suricata
And you can check out all the logs under /var/log/suricata/INSTANCE:
[2.3-RELEASE][root@pf.kar.int]/root: ls -1 /var/log/suricata/suricata_re034499/
alerts.log
alerts.log.2016_0501_1750
barnyard2
http.log
suricata.log
unified2.alert.1462653477
And you will also notice that it creates a cronjob to monitor the services:
[2.3-RELEASE][root@pf.kar.int]/root: grep watch /etc/crontab
*/1	*	*	*	*	root	/usr/local/pkg/servicewatchdog_cron.php