pfSense on Netgate APU4 1Gb Testing
I recently played around with AsusWRT and a 1Gb WAN connection and I was actually pretty happy with the results. Check out my previous post on that. And I want to try the same thing on my pfSense firewall which was running on the Netgate APU4.
Direct Speed Test
Plugging my laptop directly into the modem, I saw the following results:
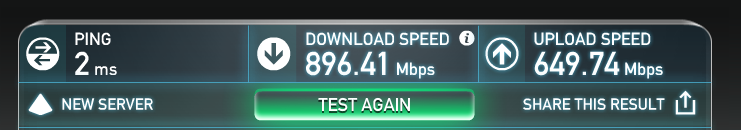
Which I was pretty happy with.
pfSense Speed Test
Adding pfSense into mix yielded the following results:
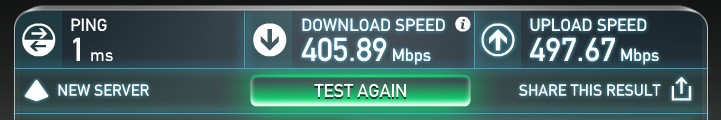
I started trying different things to see if that would help.
TSO with Realtek RTL8111E
Checking over the hardware, I saw the following:
[2.3.2-RELEASE][root@pf.kar.int]/root: pciconf -lv re0@pci0:1:0:0
re0@pci0:1:0:0:	class=0x020000 card=0x012310ec chip=0x816810ec rev=0x06 hdr=0x00
    vendor     = 'Realtek Semiconductor Co., Ltd.'
    device     = 'RTL8111/8168/8411 PCI Express Gigabit Ethernet Controller'
    class      = network
    subclass   = ethernet

[2.3.2-RELEASE][root@pf.kar.int]/root: dmesg | grep re0
re0: <RealTek 8168/8111 B/C/CP/D/DP/E/F/G PCIe Gigabit Ethernet> port 0x1000-0x10ff mem 0xf7a00000-0xf7a00fff,0xf7900000-0xf7903fff irq 16 at device 0.0 on pci1
re0: Using 1 MSI-X message
re0: ASPM disabled
re0: Chip rev. 0x2c000000
re0: MAC rev. 0x00200000
miibus0: <MII bus> on re0
re0: Using defaults for TSO: 65518/35/2048
re0: Ethernet address: 00:XX:XX:XX:XX
re0: netmap queues/slots: TX 1/256, RX 1/256
I noticed that by enabling TSO, LAN speed actually went up. Before enabling TSO here are the results of a local iperf test:
[2.3.2-RELEASE][root@pf.kar.int]/root: iperf -c 192.168.1.100 -w 2m
------------------------------------------------------------
Client connecting to 192.168.1.100, TCP port 5001
TCP window size: 2.00 MByte (WARNING: requested 2.00 MByte)
------------------------------------------------------------
[  3] local 192.168.1.99 port 63862 connected with 192.168.1.100 port 5001
[ ID] Interval       Transfer     Bandwidth
[  3]  0.0-10.0 sec   873 MBytes   732 Mbits/sec
Then enabling TSO on the local LAN nic:
[2.3.2-RELEASE][root@pf.kar.int]/root: ifconfig re1 | grep options
       	options=8209b<RXCSUM,TXCSUM,VLAN_MTU,VLAN_HWTAGGING,VLAN_HWCSUM,WOL_MAGIC,LINKSTATE>
       	nd6 options=21<PERFORMNUD,AUTO_LINKLOCAL>
[2.3.2-RELEASE][root@pf.kar.int]/root: ifconfig re1 tso
[2.3.2-RELEASE][root@pf.kar.int]/root: ifconfig re1 | grep options
       	options=8219b<RXCSUM,TXCSUM,VLAN_MTU,VLAN_HWTAGGING,VLAN_HWCSUM,TSO4,WOL_MAGIC,LINKSTATE>
       	nd6 options=21<PERFORMNUD,AUTO_LINKLOCAL>
BTW if you want to check supported features on the NIC you can run ifconfig -m
[2.3.2-RELEASE][root@pf.kar.int]/root: ifconfig -m re1 | grep capa
       	capabilities=1839db<RXCSUM,TXCSUM,VLAN_MTU,VLAN_HWTAGGING,POLLING,VLAN_HWCSUM,TSO4,WOL_UCAST,WOL_MCAST,WOL_MAGIC,LINKSTATE,NETMAP>
After enabling TSO, I saw the following:
[2.3.2-RELEASE][root@pf.kar.int]/root: iperf -c 192.168.1.100 -w 2m
------------------------------------------------------------
Client connecting to 192.168.1.100, TCP port 5001
TCP window size: 2.00 MByte (WARNING: requested 2.00 MByte)
------------------------------------------------------------
[  3] local 192.168.1.99 port 6017 connected with 192.168.1.100 port 5001
[ ID] Interval       Transfer     Bandwidth
[  3]  0.0-10.0 sec  1.07 GBytes   920 Mbits/sec
But unfortunately that didn’t help with the LAN -> WAN speed.
Other Performance Tweaks
Reading over Tuning and Troubleshooting Network Cards, I tried some of the different settings, like increasing the mbuf / nmbclusters setting:
kern.ipc.nmbclusters="131072"
But that didn’t help. I also tried disabling and enabling the different options available in pfSense under System -> Advanced -> Networking:
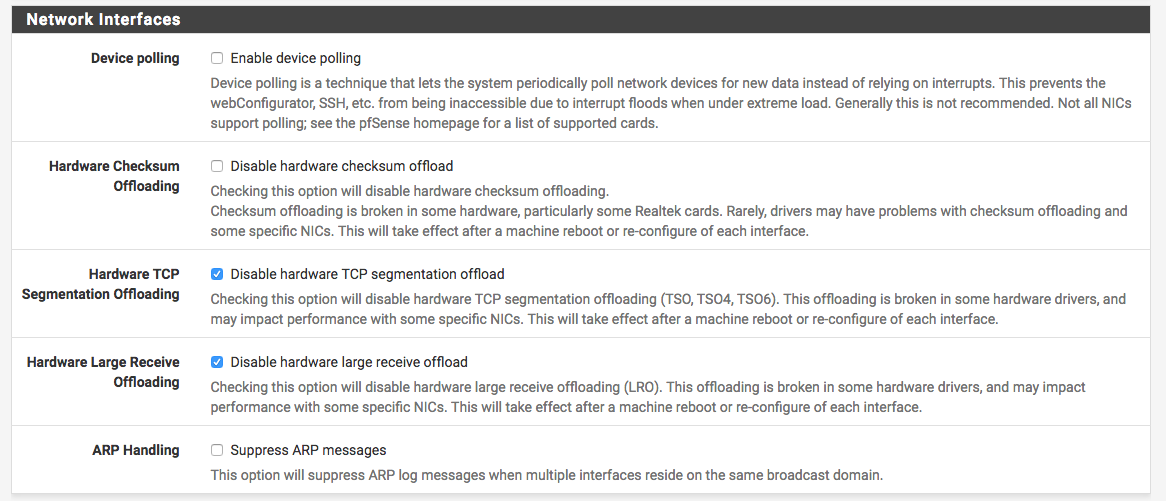
The following options didn’t help:
- Disabling RXSUM and TXSUM
- Enabling Polling, rendered the nic down
- Enabling LRO
- Enabling PowerD
Checking out the CPU Usage
Running top -aSH showed that NIC interrupts are high but not completely taking over the CPU:
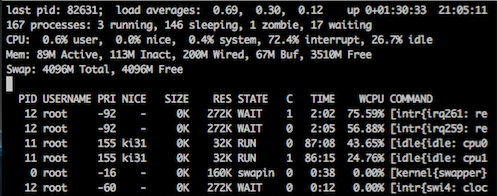
Reading over the FreeBSD forwarding Performance, I tried using the pmcstat tool to see if pf is taking a lot of the kernel time, and when I ran the following:
kldload hwpmc
pmcstat -TS instructions -w1
The biggest user was sbuf_bcat (memory allocation):
PMC: [FR_RETIRED_X86_INSTRUCTIONS] Samples: 2836 (100.0%) , 73 unresolved

%SAMP IMAGE      FUNCTION             CALLERS
 35.6 kernel     sbuf_bcat            sysctl_kern_malloc_stats:35.0 ...
  3.5 kernel     pagezero             vm_fault_hold
  2.4 kernel     pmap_remove_pages    vmspace_exit:1.5 exec_new_vmspace:0.9
  2.0 kernel     copyout              copyout_nofault
  1.4 libc.so.7  bsearch              0x64d4
  1.4 kernel     vm_fault_hold        vm_fault
  1.2 kernel     pmap_enter           vm_fault_hold
  1.1 kernel     get_pv_entry         pmap_try_insert_pv_entry
and pf stayed pretty low.
PMC: [FR_RETIRED_X86_INSTRUCTIONS] Samples: 12178 (100.0%) , 0 unresolved

%SAMP IMAGE      FUNCTION             CALLERS
 23.2 kernel     sched_idletd         fork_exit
  6.1 kernel     pf_test              pf_check_out:3.3 pf_check_in:2.8
  4.3 kernel     bzero                pf_test:1.7 pf_test_state_tcp:1.1 ...
  3.3 kernel     pf_test_state_tcp    pf_test
  3.0 kernel     __rw_rlock           bpf_mtap:0.9 in_localip:0.9
But still nothing in the high 70s for the percentage.
I was also reading over the PCEngines APU board with pfsense setup and decided to try out powerd. After enabling it, I couldn’t run the powerd command, and it turned out to be a known bug. After adding the following to the /boot/device.hints file, it started working:
hint.acpi_throttle.0.disabled="0"
hint.p4tcc.0.disabled="0"
After that you will also get more info from sysctl:
[2.3.2-RELEASE][root@pf.kar.int]/root: sysctl dev.cpu.0
dev.cpu.0.temperature: 57.0C
dev.cpu.0.cx_usage: 100.00% 0.00% last 240us
dev.cpu.0.cx_lowest: C1
dev.cpu.0.cx_supported: C1/1/0 C2/2/100
dev.cpu.0.freq_levels: 1000/-1 875/-1 750/-1 625/-1 500/-1 375/-1 250/-1 125/-1
dev.cpu.0.freq: 1000
dev.cpu.0.%parent: acpi0
dev.cpu.0.%pnpinfo: _HID=none _UID=0
dev.cpu.0.%location: handle=\_PR_.C000
dev.cpu.0.%driver: cpu
dev.cpu.0.%desc: ACPI CPU
And it should be running in the background:
[2.3.2-RELEASE][root@pf.kar.int]/root: ps auwwx | grep power
root    86054   0.0  0.0  14408  1956  -  Ss    7:57PM  0:00.06 /usr/sbin/powerd -b hadp -a max -n hadp
When I was running the speedtest I also ran powerd and here is what I saw:
[2.3.2-RELEASE][root@pf.kar.int]/root: powerd -v
load   4%, current freq  500 MHz ( 4), wanted freq  403 MHz
load   0%, current freq  500 MHz ( 4), wanted freq  390 MHz
load   7%, current freq  500 MHz ( 4), wanted freq  377 MHz
load   0%, current freq  500 MHz ( 4), wanted freq  365 MHz
changing clock speed from 500 MHz to 375 MHz
load   0%, current freq  375 MHz ( 5), wanted freq  353 MHz
load   3%, current freq  375 MHz ( 5), wanted freq  341 MHz
load 113%, current freq  375 MHz ( 5), wanted freq 1364 MHz
changing clock speed from 375 MHz to 1000 MHz
load 104%, current freq 1000 MHz ( 0), wanted freq 2000 MHz
load 135%, current freq 1000 MHz ( 0), wanted freq 2000 MHz
load 132%, current freq 1000 MHz ( 0), wanted freq 2000 MHz
load 132%, current freq 1000 MHz ( 0), wanted freq 2000 MHz
load 138%, current freq 1000 MHz ( 0), wanted freq 2000 MHz
load 138%, current freq 1000 MHz ( 0), wanted freq 2000 MHz
load 148%, current freq 1000 MHz ( 0), wanted freq 2000 MHz
load 142%, current freq 1000 MHz ( 0), wanted freq 2000 MHz
load 172%, current freq 1000 MHz ( 0), wanted freq 2000 MHz
load 154%, current freq 1000 MHz ( 0), wanted freq 2000 MHz
load 160%, current freq 1000 MHz ( 0), wanted freq 2000 MHz
...
...
load 148%, current freq 1000 MHz ( 0), wanted freq 2000 MHz
load 160%, current freq 1000 MHz ( 0), wanted freq 2000 MHz
load 154%, current freq 1000 MHz ( 0), wanted freq 2000 MHz
load 169%, current freq 1000 MHz ( 0), wanted freq 2000 MHz
load 154%, current freq 1000 MHz ( 0), wanted freq 2000 MHz
And the speedtest results were the same, looks like I need more CPU power.
Other Resources
As I kept reading about the APU4 unit I ran into a bunch of folks that mentioned the same limitation:
-
Netgate Router Recommendation?
I’ve anecdotally heard the APU series is good for 500-600mbit/sec worth of NAT (at 100% CPU) and our own testing suggests it should be good for at least 30-40mbit/sec of VPN at AES128 (not using AES-GCM, projected based on CPU usage with our current WAN link).
-
Throughput numbers for new SG-* devices?
We have the un-branded SG-2440 box and we pushed about 600mbit of our 1000mbit link through it before it pegged the CPU… it went a bit over 600 a few times, but never maxed out our link.
-
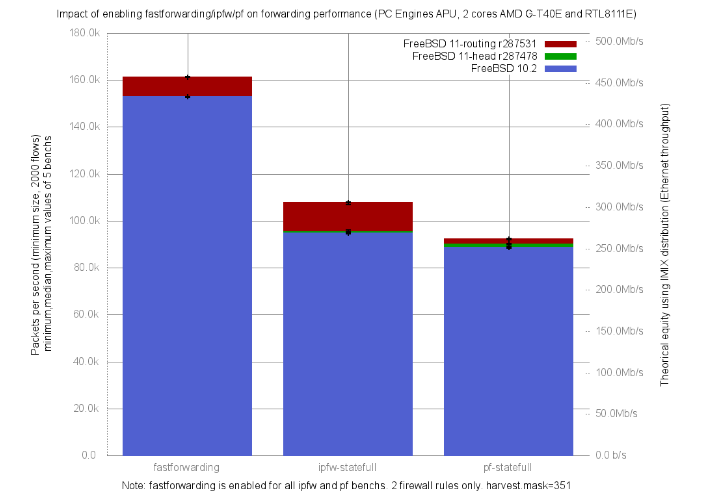
netbenches/AMD_G-T40E_2Cores_RTL8111E/fastforwarding-pf-ipfw/results/fbsd11-routing.r287531
-
pfSense home router using the PC Engines APU1D4
Throughput: without heavy use (squid, snort, etc.) you should see 400-500 Mbit WAN->LAN (limited by the realtek NICs). I know Mbit is not a good measure of a router/firewall performance but this is what matters to me at home. I saw mentions of 600 Mbit. I was eager to deploy it so I didn’t do any testing so all I can say is that 300Mbit works fine without any strain.
So after all my testing and actually enabling TSO (it helped with suricata offloading) this the best I could get (about ~530Mb down):

Other Hardware
Now that I know the limitation, next time I am upgrading my firewall, I will grab one of these:
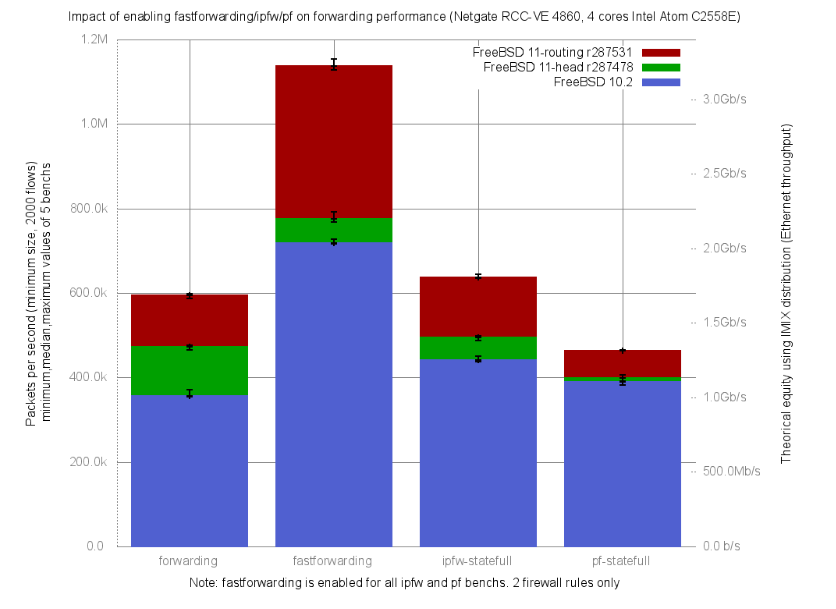
- netbenches/Atom_C2558_4Cores-Intel_i350/fastforwarding-pf-ipfw/results/fbsd11-routing.r287531
- Netgate RCC-VE 4860
- Playing with FreeBSD packet filter state table limits
- Netgate RCC-VE 4860
- Thinking of switching to pfsense
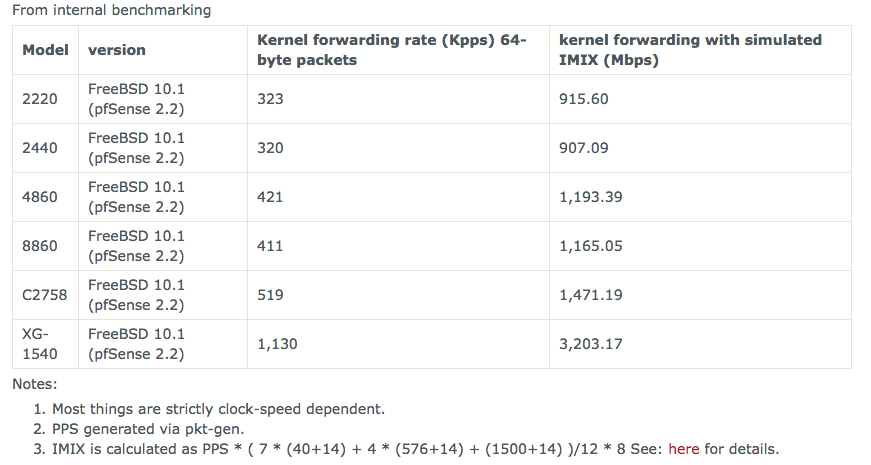
- Nice table from there (SG-2440):
-
Gigabit WAN speeds with RCC-VE 2440?
Well, I am very happy to report that with 2.3 installed, and PowerD set to Maximum, I am now achieving expected speeds! My recent speed test shows 810.67Mbps down, and 936.71Mbps up.
-
pfSense, m-ITX quad-core, 1Gbit, <20w
TCP tests ended up around ~990Mbit/s. TCP test was also performed with iperf, test was done from a server within LAN to a server outside WAN. Server on the Internet -> WAN -> NAT -> LAN -> server on the LAN.