Install Zabbix on pfSense
After I installed pfSense, setup Suricata on pfSense, and setup logging on pfSense I decided to also monitor the machine it self. I use Zabbix to accomplish this at home.
Install Zabbix
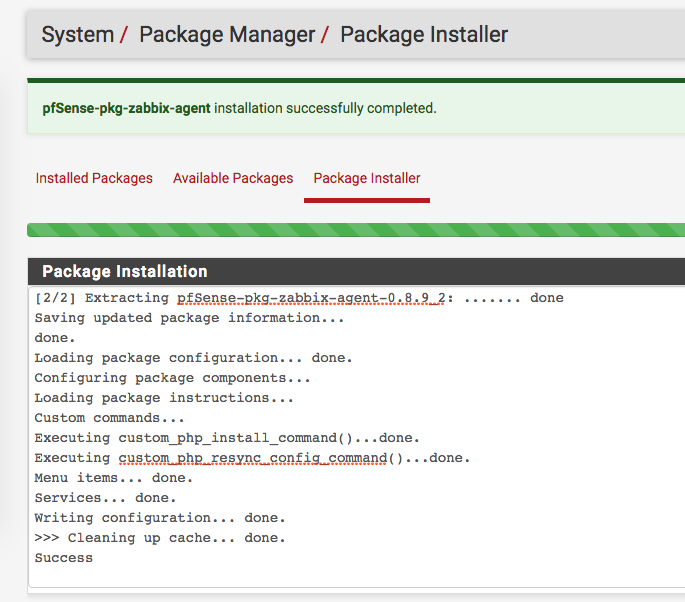
Currently pfSense allows you to install Zabbix 2.2 (which is kind of old, but it will work). It looks like Zabbix 3.0 is on it’s way: zabbix-3.0 for pfsense-2.3. While we wait for that let’s install Zabbix 2.2 and configure it. The install is pretty simple, just go to System -> Package Manager -> Available Packages, search for Zabbix and install it. After it’s done installing you will see something like this:
Configure Zabbix
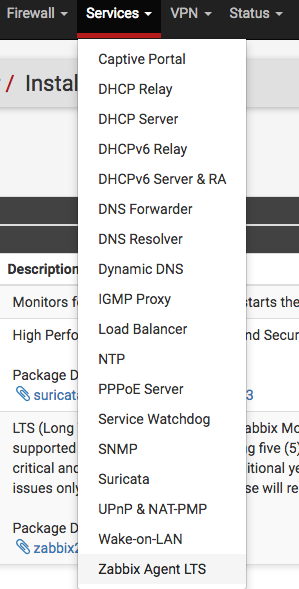
After it’s installed you can configure the settings if you go to Services -> Zabbix Agent LTS:
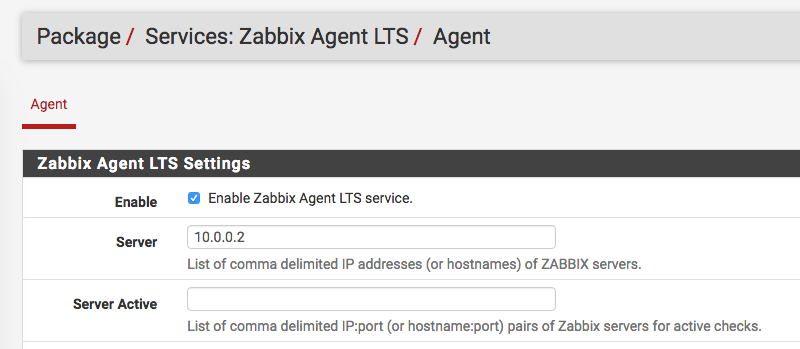
If you want the basics just configure the Zabbix Server IP and pfSense Hostname (and leave the rest as is):
Open Up the firewall
I decided to monitor the pfSense machine from it’s OPT1 interface since the LAN one was doing all the NAT’ing. Under Firewall -> Rules -> OPT1 I added a rule to allow port 10050 inbound:

Adding the Agent in Zabbix
After that, all we have to do is just add an agent in Zabbix and point it to the OPT1 interface of the pfSense machine. So in the Zabbix UI go to Configuration -> Hosts -> Create Host and add the settings:
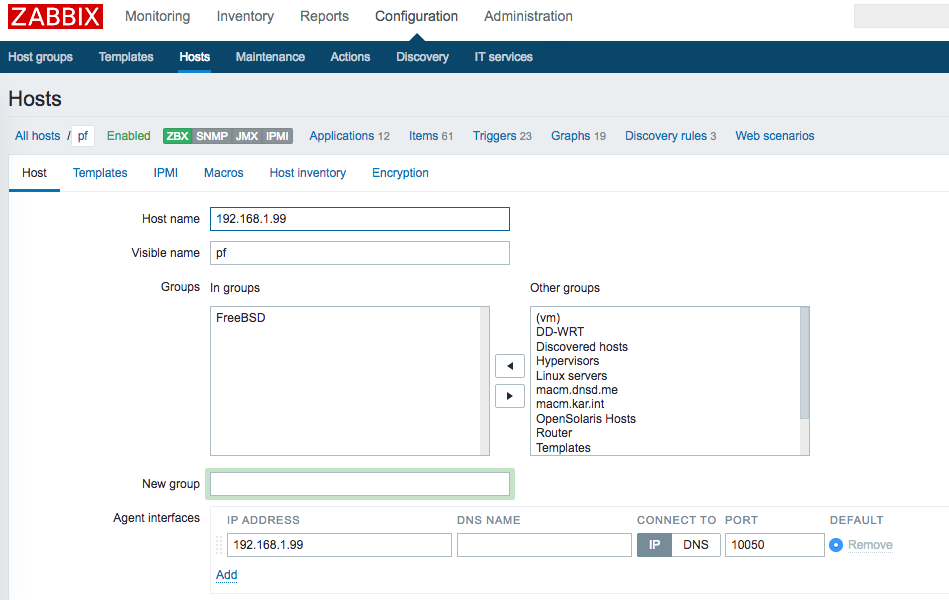
And under templates I added the Template OS FreeBSD one:

I also noticed that by default with the FreeBSD template it wasn’t able to discover the interfaces (it assumed only em0 would be used). I looked under discovery rules and only the filesystem one was present:

I looked around and it looks like the template has been enhanced since and there was a bunch of zabbix bugs on that:
And I was just behind on that. So I went to Zabbix Templates/Official Templates/2.2 and downloaded the Template_OS_FreeBSD-2.2.5.xml template. After importing that (Configuration -> Templates -> Import) I saw the other discovery rule and other interfaces were now seen:

Adding Advanced User Parameters
I covered a similar setup in Monitor SMART Attributes with Zabbix and Monitor Disk IO Stats with Zabbix so I am not going to go into great detail on the setup. I basically added the following UserParameters to the pfSense Zabbix agent (Services -> Zabbix Agents LTS -> Show Advanced Options):
UserParameter=freebsd.sensor.cpu[*],/sbin/sysctl -n dev.cpu.$1.temperature | /usr/bin/grep -o '[0-9]\?[0-9][0-9]\.[0-9]'
UserParameter=custom.disks.freebsd_discovery,/usr/sbin/iostat -x -t da | /usr/bin/awk 'NF>0{if ($1 ~ /^[a-z]+[0-9]+$/)a[cnt++]=$1} END{print "{\"data\":["; for(i=0; i<length(a)-1; i++) printf("{ \"{#DISK}\":\"%s\"},\n", a[i]); printf("{ \"{#DISK}\":\"%s\"}\n]}\n", a[i])}'
UserParameter=custom.vfs.dev.read.ops[*],/usr/bin/grep $1 /tmp/iostat.txt | /usr/bin/tail -1 | /usr/bin/awk '{print $$2}'
UserParameter=custom.vfs.dev.write.ops[*],/usr/bin/grep $1 /tmp/iostat.txt |/usr/bin/tail -1| /usr/bin/awk '{print $$3}'
UserParameter=custom.vfs.dev.read.kbs[*],/usr/bin/grep $1 /tmp/iostat.txt |/usr/bin/tail -1| /usr/bin/awk '{print $$4}'
UserParameter=custom.vfs.dev.write.kbs[*],/usr/bin/grep $1 /tmp/iostat.txt |/usr/bin/tail -1| /usr/bin/awk '{print $$5}'
UserParameter=custom.vfs.dev.io_latency.ms[*],/usr/bin/grep $1 /tmp/iostat.txt |/usr/bin/tail -1| /usr/bin/awk '{print $$7}'
UserParameter=custom.vfs.dev.qlen_usage.percent[*],/usr/bin/grep $1 /tmp/iostat.txt |/usr/bin/tail -1| /usr/bin/awk '{print $$8}'
And with those in place, I could query the necessary information from my Zabbix server. For example here is the discovery one:
┌─[elatov@kerch] - [/home/elatov] - [2016-05-15 11:29:52]
└─[0] <> zabbix_get -s 192.168.1.99 -k "custom.disks.freebsd_discovery"
{"data":[
{ "{#DISK}":"md0"},
{ "{#DISK}":"da0"}
]}
And here is the CPU one:
┌─[elatov@kerch] - [/home/elatov] - [2016-05-15 11:29:58]
└─[0] <> zabbix_get -s 192.168.1.99 -k "freebsd.sensor.cpu[0]"
57.5
Then following the instuctions from the above posts I created discovery rules, graphs, and items as necessary.
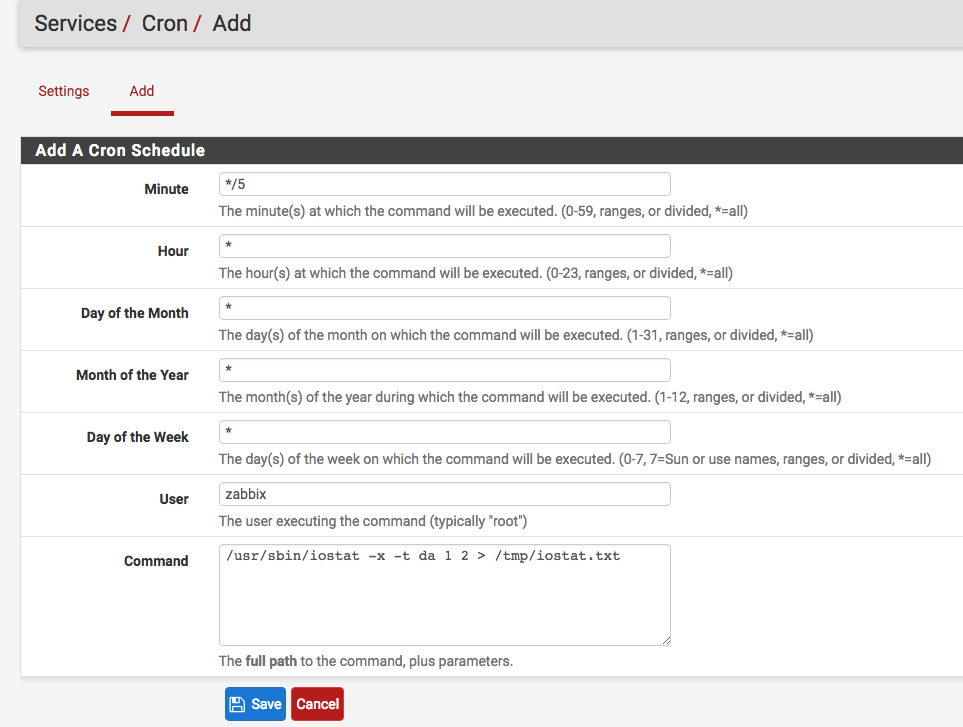
Creating a Cron Job for iostat
From past I noticed that it’s better to just query a file with the command output rather then running a command and parsing it on the fly with the Zabbix agent. You will notice that the IO Performance UserParameters are expecting a file called /tmp/iostat.txt to have the output of iostat. So on the pfSense box first I installed the cron package:

And then under Services -> Cron -> Add, I created the following cron job:
Graphs for pfSense
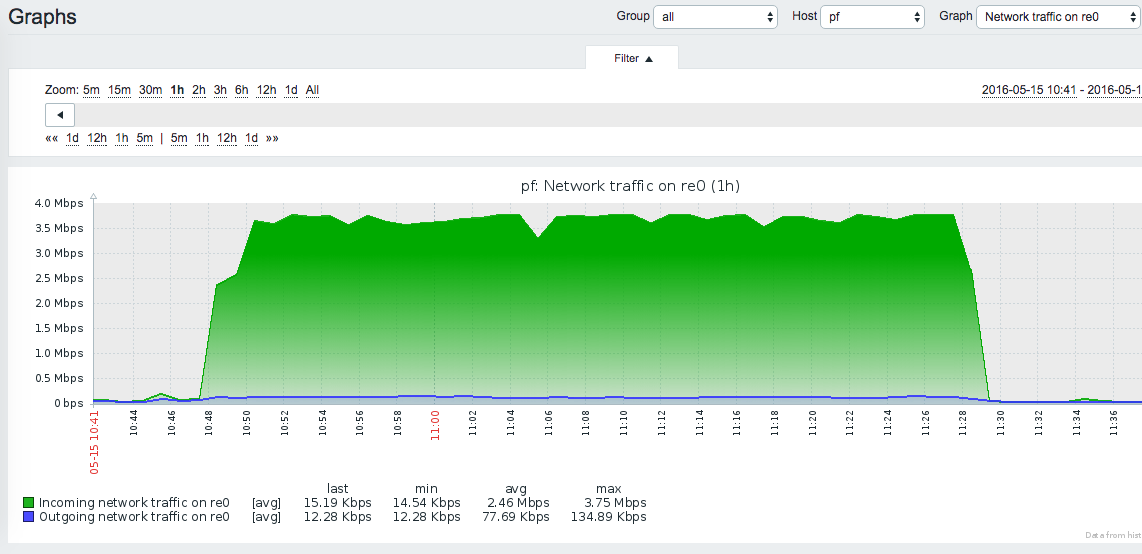
After it was said and done I could see all the bandwidth on all the interfaces (after importing the appropriate FreeBSD template):
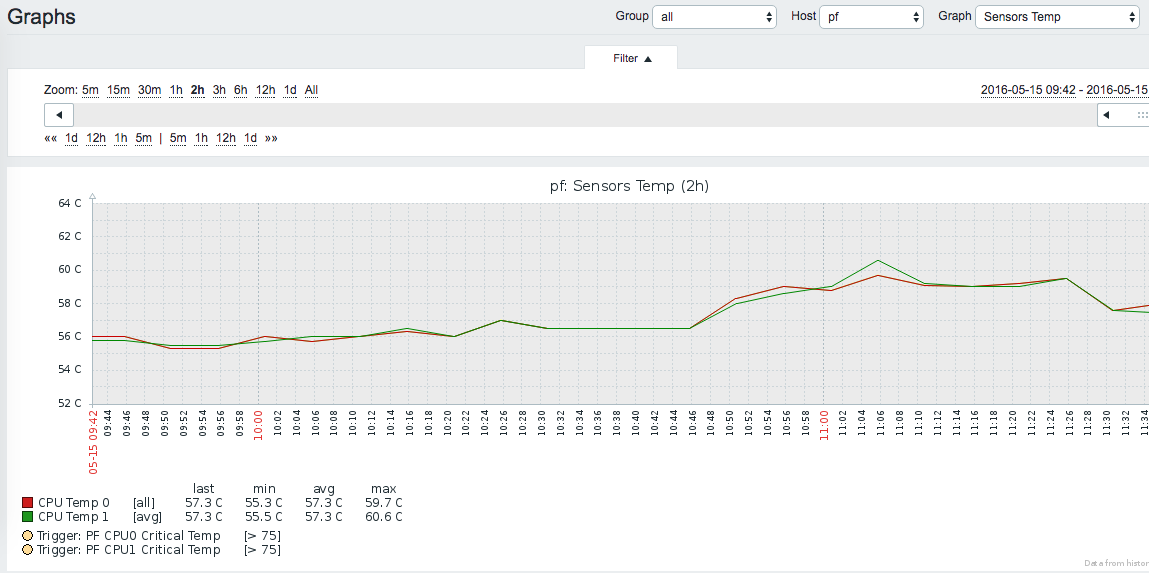
I could check out the temperature of the CPU and trigger on something that is high:
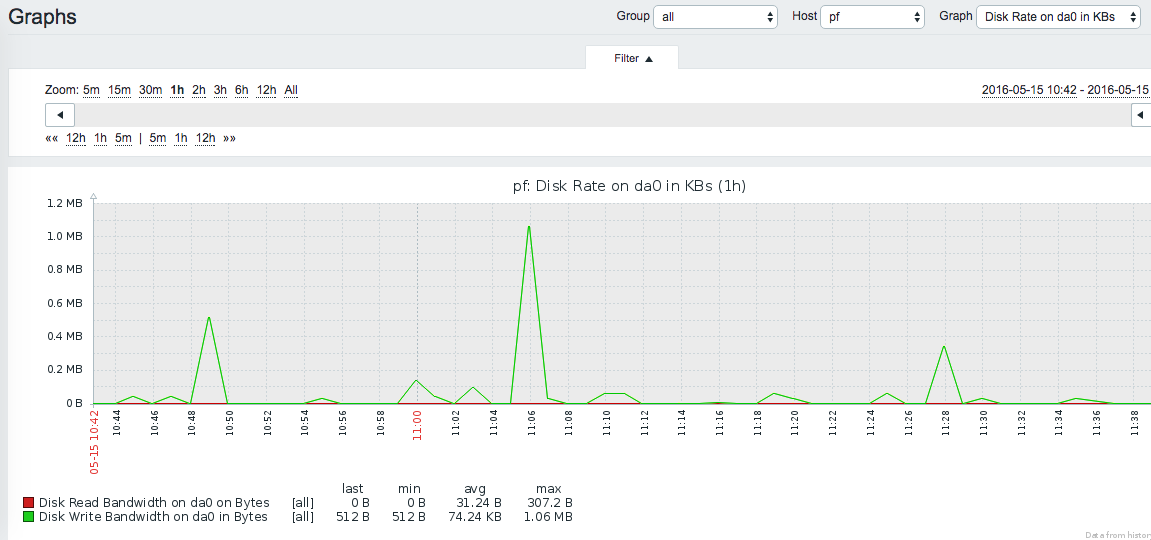
I could also see if there are any spikes in the disk usage:
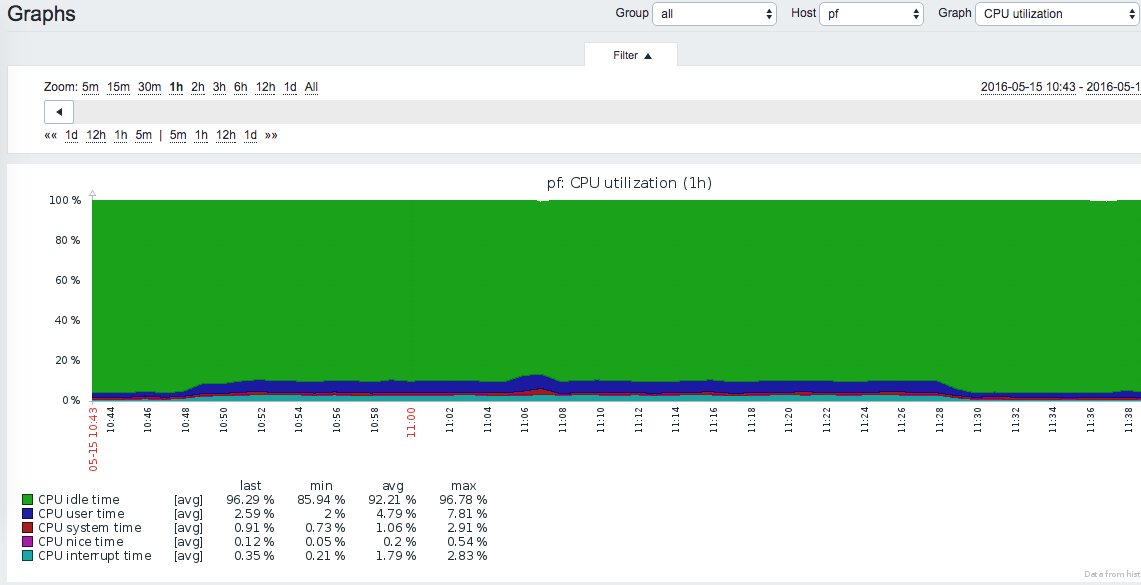
And I could also check out the CPU usage (which is available from the default template):
