Updating to ElasticStack 5.0
Updating Logstash, ElasticSearch, and Kibana to 5.0
I had the following versions installed of the ELK (elasticsearch,logstash,kibana) Stack:
<> rpm -qa | grep -iE 'kibana|elastic|logst'
logstash-2.3.4-1.noarch
elasticsearch-2.4.1-1.noarch
kibana-4.5.4-1.x86_64
I read over the Upgrading the Elastic Stack, and here is the recommended update order:
- Elasticsearch Hadoop (can talk to Elasticsearch 5.0 and 2.x)
- Elasticsearch
- X-Pack for Elasticsearch (combines Marvel Agent, Shield, Watcher, and Graph)
- Kibana (now includes Timelion and Console, formerly known as Sense)
- X-Pack for Kibana (combines Marvel, Shield, Graph, and Reporting)
- Logstash
- Beats
Let’s try it out.
Updating ElasticSearch from 2.4 to 5.0
Reading over Upgrading Elasticsearch there is a table of suggested updates.
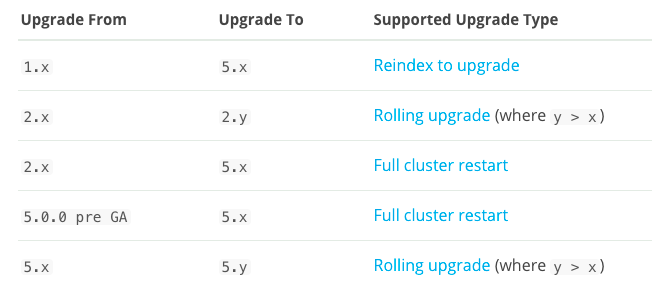
I think the biggest concern is whether you need to reindex old indices. I was on elasticsearch 2.4 and I was using logstash’s time based indices so I didn’t need to worry about that (I also used curator to delete old indices):
<> curl 'localhost:9200/_cat/indices?v'
health status index               pri rep docs.count docs.deleted store.size pri.store.size
yellow open   logstash-2016.10.22   5   1     172206            0     66.1mb         66.1mb
yellow open   logstash-2016.10.23   5   1     237647            0     86.8mb         86.8mb
yellow open   logstash-2016.10.24   5   1    1834855            0
   62.7mb         62.7mb
...
yellow open   .kibana               1   1         46            1       63kb           63kb
yellow open   logstash-2016.10.05   5   1     135822            0     58.4mb         58.4mb
So I didn’t worry about the re-index and update approach. I then stopped logstash and kibana in preparation for the update:
<> sudo systemctl stop logstash.service
<> sudo systemctl stop kibana
After that I went to the Full cluster restart upgrade page and started the update. First disable shard allocation:
<> curl -XPUT 'localhost:9200/_cluster/settings?pretty' -d'
 > {
 >   "persistent": {
 >     "cluster.routing.allocation.enable": "none"
 >   }
 > }'
{
  "acknowledged" : true,
  "persistent" : {
    "cluster" : {
      "routing" : {
        "allocation" : {
          "enable" : "none"
        }
      }
    }
  },
  "transient" : { }
}
Next perform a synced flush:
<> curl -XPOST 'localhost:9200/_flush/synced?pretty'
{
  "_shards" : {
    "total" : 552,
    "successful" : 276,
    "failed" : 0
  },
  "logstash-2016.10.22" : {
    "total" : 10,
    "successful" : 5,
    "failed" : 0
  },
  "logstash-2016.10.23" : {
    "total" : 10,
    "successful" : 5,
    "failed" : 0
  },
	...
  },
  ".kibana" : {
    "total" : 2,
    "successful" : 1,
    "failed" : 0
  },
}
Now let’s shutdown the node.
<> sudo systemctl stop elasticsearch.service
And then we can check out the Install Elasticsearch with RPM page. We just need to update our repo file to look like this:
<> cat /etc/yum.repos.d/es.repo
[elasticsearch-5.x]
name=Elasticsearch repository for 5.x packages
baseurl=https://artifacts.elastic.co/packages/5.x/yum
gpgcheck=1
gpgkey=https://artifacts.elastic.co/GPG-KEY-elasticsearch
enabled=1
autorefresh=1
type=rpm-md
and import the GPG key:
<> sudo rpm --import https://artifacts.elastic.co/GPG-KEY-elasticsearch
And now for the update:
<> sudo yum update elasticsearch
Loaded plugins: fastestmirror, remove-with-leaves
Loading mirror speeds from cached hostfile
 * atomic: www3.atomicorp.com
 * base: denver.gaminghost.co
 * epel: muug.ca
 * extras: mirrors.unifiedlayer.com
 * updates: mirrors.ocf.berkeley.edu
Resolving Dependencies
--> Running transaction check
---> Package elasticsearch.noarch 0:2.4.1-1 will be updated
---> Package elasticsearch.noarch 0:5.0.0-1 will be an update
	Total download size: 31 M
	...
Is this ok [y/d/N]: y
Downloading packages:
No Presto metadata available for elasticsearch-5.x
elasticsearch-5.0.0.rpm                                                                                                                                                   |  31 MB  00:00:02
Running transaction check
Running transaction test
Transaction test succeeded
Running transaction
  Updating   : elasticsearch-5.0.0-1.noarch                                                                                                                                                  1/2
  Cleanup    : elasticsearch-2.4.1-1.noarch                                                                                                                                                  2/2
warning: /etc/elasticsearch/logging.yml saved as /etc/elasticsearch/logging.yml.rpmsave
  Verifying  : elasticsearch-5.0.0-1.noarch                                                                                                                                                  1/2
  Verifying  : elasticsearch-2.4.1-1.noarch                                                                                                                                                  2/2

Updated:
  elasticsearch.noarch 0:5.0.0-1

Complete!
I didn’t have any plugins so at this point I just started the service back up:
<> sudo systemctl daemon-reload
<> sudo systemctl start elasticsearch.service
<> sudo journalctl -fu elasticsearch.service
-- Logs begin at Wed 2016-10-26 07:23:03 MDT. --
Oct 29 10:33:00 puppet.kar.int elasticsearch[944]: at java.lang.Thread.run(Thread.java:745)
Oct 29 14:26:09 puppet.kar.int elasticsearch[944]: [2016-10-29 14:26:09,954][INFO ][cluster.routing.allocation.decider] [Fashima] updating [cluster.routing.allocation.enable] from [ALL] to [NONE]
Oct 29 14:29:18 puppet.kar.int systemd[1]: Stopping Elasticsearch...
Oct 29 14:29:18 puppet.kar.int elasticsearch[944]: [2016-10-29 14:29:18,199][INFO ][node                     ] [Fashima] stopping ...
Oct 29 14:29:18 puppet.kar.int elasticsearch[944]: [2016-10-29 14:29:18,502][INFO ][node                     ] [Fashima] stopped
Oct 29 14:29:18 puppet.kar.int elasticsearch[944]: [2016-10-29 14:29:18,502][INFO ][node                     ] [Fashima] closing ...
Oct 29 14:29:18 puppet.kar.int elasticsearch[944]: [2016-10-29 14:29:18,512][INFO ][node                     ] [Fashima] closed
Oct 29 14:29:18 puppet.kar.int systemd[1]: Stopped Elasticsearch.
Oct 29 14:35:00 puppet.kar.int systemd[1]: Starting Elasticsearch...
Oct 29 14:35:00 puppet.kar.int systemd[1]: Started Elasticsearch.
Then we can check out the status:
<> curl -XGET 'localhost:9200/_cat/health?pretty'
1477773428 14:37:08 elasticsearch yellow 1 1 276 276 0 0 276 0 - 50.0%

<> curl -XGET 'localhost:9200/_cat/nodes?pretty'
127.0.0.1 23 97 19 0.48 0.38 0.28 mdi * NVsq0kL
and then we can confirm the indices are okay as well:
<> curl 'localhost:9200/_cat/indices?v'
health status index               uuid                   pri rep docs.count docs.deleted store.size pri.store.size
yellow open   logstash-2016.09.28 U19hImjjTImCAOzT5RSYHw   5   1     140980            0     64.9mb         64.9mb
...
yellow open   .kibana             m4qTcJx4TKi9zxZaWufOoA   1   1         46            1       63kb           63kb
...
yellow open   logstash-2016.09.30 9Ayf0BgRS6mvVtoW_f_oNw   5   1     143003            0       67mb           67mb
Now let’s renabled allocation:
<> curl -XPUT 'localhost:9200/_cluster/settings?pretty' -d'
 > {
 >   "persistent": {
 >     "cluster.routing.allocation.enable": "all"
 >   }
 > }'
{
  "acknowledged" : true,
  "persistent" : {
    "cluster" : {
      "routing" : {
        "allocation" : {
          "enable" : "all"
        }
      }
    }
  },
  "transient" : { }
}
You can also confirm the version of elasticsearch:
<> curl -XGET 'localhost:9200'
{
  "name" : "NVsq0kL",
  "cluster_name" : "elasticsearch",
  "cluster_uuid" : "E4lDuM2KRH-Mi11k_7jiKQ",
  "version" : {
    "number" : "5.0.0",
    "build_hash" : "253032b",
    "build_date" : "2016-10-26T04:37:51.531Z",
    "build_snapshot" : false,
    "lucene_version" : "6.2.0"
  },
  "tagline" : "You Know, for Search"
}
Updating Kibana from 4.5 to 5.0
I read over Upgrading Kibana and checking out the table, I can just do a standard upgrade without doing a re-index (since I was using logstash’s time based indices):
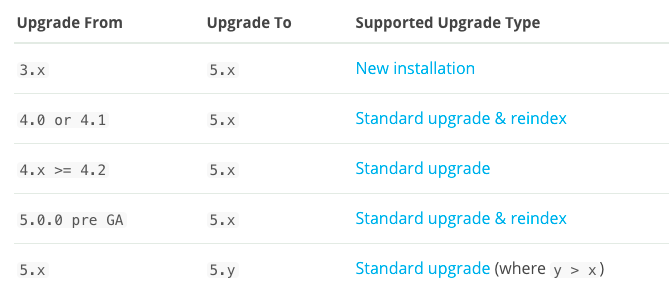
I started using Kibana from 4.3 and above (you can check out the original setup that I did here) so I was good. The steps for the update are layed out in the Standard Upgrade page. First you stop the kibana instance, which I did above. Then install the rpm, since elasticsearch and kibana share the repo, I didn’t have to do anything special. Then I performed the update:
<> sudo yum update kibana
[sudo] password for elatov:
Loaded plugins: fastestmirror, remove-with-leaves
Loading mirror speeds from cached hostfile
 * atomic: www3.atomicorp.com
 * base: denver.gaminghost.co
 * epel: muug.ca
 * extras: mirrors.unifiedlayer.com
 * updates: mirrors.ocf.berkeley.edu
Resolving Dependencies
--> Running transaction check
---> Package kibana.x86_64 0:4.5.4-1 will be updated
---> Package kibana.x86_64 0:5.0.0-1 will be an update
--> Finished Dependency Resolution

	Upgrade  1 Package

Total download size: 39 M
Is this ok [y/d/N]: y
Downloading packages:
No Presto metadata available for elasticsearch-5.x
kibana-5.0.0-x86_64.rpm                                                                                                                                                   |  39 MB  00:00:04
Running transaction check
Running transaction test
Transaction test succeeded
Running transaction
  Updating   : kibana-5.0.0-1.x86_64                                                                                                                                                         1/2
Stopping kibana service... OK
  Cleanup    : kibana-4.5.4-1.x86_64                                                                                                                                                         2/2
warning: /opt/kibana/config/kibana.yml saved as /opt/kibana/config/kibana.yml.rpmsave
  Verifying  : kibana-5.0.0-1.x86_64                                                                                                                                                         1/2
  Verifying  : kibana-4.5.4-1.x86_64                                                                                                                                                         2/2

Updated:
  kibana.x86_64 0:5.0.0-1

Complete!
Then I went ahead and copied the config over:
<> sudo cp /etc/kibana/kibana.yml /etc/kibana/kibana.yml.orig
<> sudo cp /opt/kibana/config/kibana.yml.rpmsave /etc/kibana/kibana.yml
I didn’t have any plugins for kibana so I just started up the service:
<> sudo systemctl daemon-reload
<> sudo systemctl start kibana.service
<> sudo journalctl -fu kibana
-- Logs begin at Wed 2016-10-26 07:23:03 MDT. --
Oct 29 14:25:21 puppet.kar.int systemd[1]: Stopped no description given.
Oct 29 14:53:59 puppet.kar.int systemd[1]: Started Kibana.
Oct 29 14:53:59 puppet.kar.int systemd[1]: Starting Kibana...
Oct 29 14:54:02 puppet.kar.int kibana[30328]: {"type":"log","@timestamp":"2016-10-29T20:54:02Z","tags":["status","plugin:kibana@5.0.0","info"],"pid":30328,"state":"green","message":"Status changed from uninitialized to green - Ready","prevState":"uninitialized","prevMsg":"uninitialized"}
Oct 29 14:54:02 puppet.kar.int kibana[30328]: {"type":"log","@timestamp":"2016-10-29T20:54:02Z","tags":["status","plugin:elasticsearch@5.0.0","info"],"pid":30328,"state":"yellow","message":"Status changed from uninitialized to yellow - Waiting for Elasticsearch","prevState":"uninitialized","prevMsg":"uninitialized"}
Oct 29 14:54:02 puppet.kar.int kibana[30328]: {"type":"log","@timestamp":"2016-10-29T20:54:02Z","tags":["status","plugin:console@5.0.0","info"],"pid":30328,"state":"green","message":"Status changed from uninitialized to green - Ready","prevState":"uninitialized","prevMsg":"uninitialized"}
Oct 29 14:54:03 puppet.kar.int kibana[30328]: {"type":"log","@timestamp":"2016-10-29T20:54:03Z","tags":["status","plugin:timelion@5.0.0","info"],"pid":30328,"state":"green","message":"Status changed from uninitialized to green - Ready","prevState":"uninitialized","prevMsg":"uninitialized"}
Oct 29 14:54:03 puppet.kar.int kibana[30328]: {"type":"log","@timestamp":"2016-10-29T20:54:03Z","tags":["status","plugin:elasticsearch@5.0.0","info"],"pid":30328,"state":"green","message":"Status changed from yellow to green - Kibana index ready","prevState":"yellow","prevMsg":"Waiting for Elasticsearch"}
Oct 29 14:54:03 puppet.kar.int kibana[30328]: {"type":"log","@timestamp":"2016-10-29T20:54:03Z","tags":["listening","info"],"pid":30328,"message":"Server running at http://0.0.0.0:5601"}
Oct 29 14:54:03 puppet.kar.int kibana[30328]: {"type":"log","@timestamp":"2016-10-29T20:54:03Z","tags":["status","ui settings","info"],"pid":30328,"state":"green","message":"Status changed from uninitialized to green - Ready","prevState":"uninitialized","prevMsg":"uninitialized"}
Then you can point your browser to the kibana dashboard and see the new version:
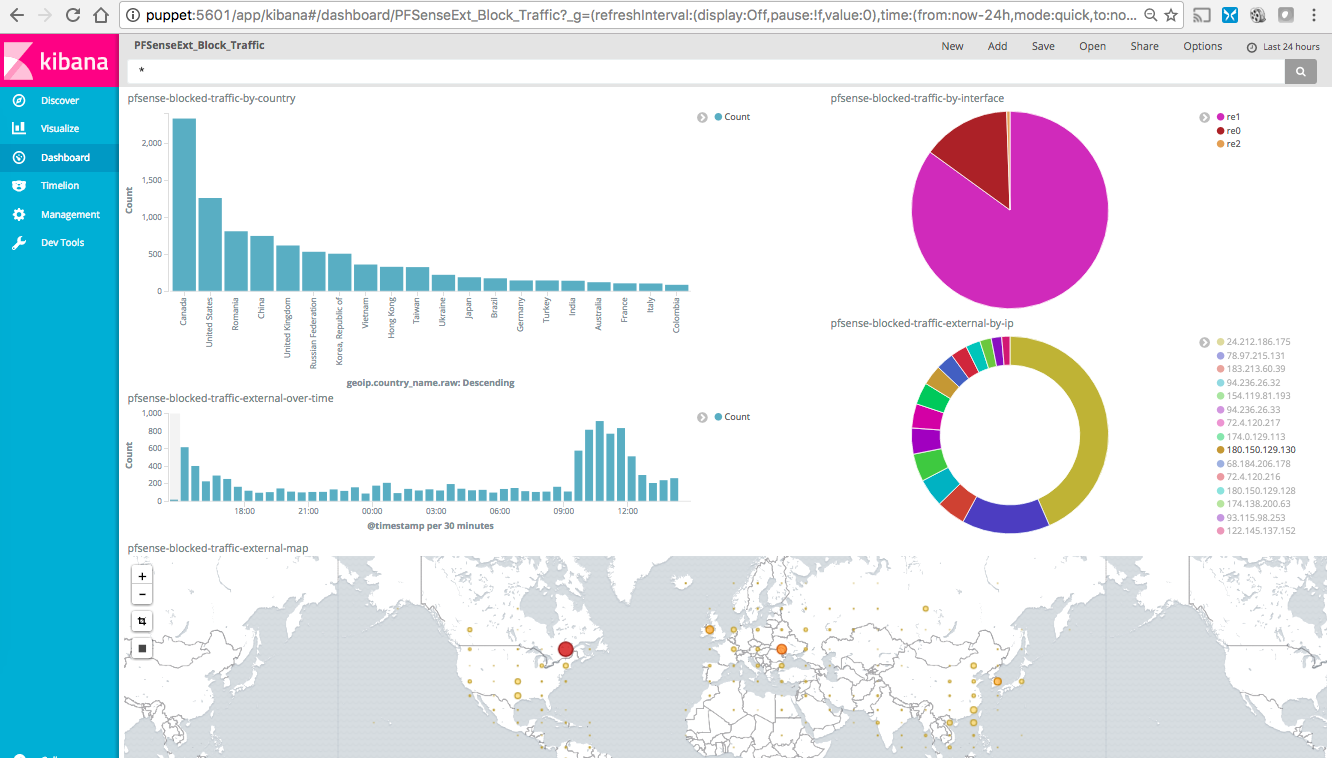
Updating Logstash from 2.3 to 5.0
I read over Upgrading Logstash to 5.0 and I didn’t see anything bad about the update. Then I followed the instructions laid out in Upgrading Using Package Managers to do the update. First stop logstash, which I did above. Then add the repo, which I did during the elasticsearch update. And then I updated the package:
<> sudo yum update
Loaded plugins: fastestmirror, remove-with-leaves
Loading mirror speeds from cached hostfile
 * atomic: www3.atomicorp.com
 * base: denver.gaminghost.co
 * epel: muug.ca
 * extras: mirrors.unifiedlayer.com
 * updates: mirrors.ocf.berkeley.edu
Resolving Dependencies
--> Running transaction check
---> Package logstash.noarch 1:2.3.4-1 will be updated
---> Package logstash.noarch 1:5.0.0-1 will be an update
--> Finished Dependency Resolution

	Upgrade  1 Package

Total download size: 101 M
Is this ok [y/d/N]: y
Downloading packages:
No Presto metadata available for elasticsearch-5.x
logstash-5.0.0.rpm                                                                                                                                                        | 101 MB  00:00:12
Running transaction check
Running transaction test
Transaction test succeeded
Running transaction
  Updating   : 1:logstash-5.0.0-1.noarch                                                                                                                                                     1/2
Using provided startup.options file: /etc/logstash/startup.options
Successfully created system startup script for Logstash
  Cleanup    : 1:logstash-2.3.4-1.noarch                                                                                                                                                     2/2
warning: /etc/logrotate.d/logstash saved as /etc/logrotate.d/logstash.rpmsave
  Verifying  : 1:logstash-5.0.0-1.noarch                                                                                                                                                     1/2
  Verifying  : 1:logstash-2.3.4-1.noarch                                                                                                                                                     2/2

Updated:
  logstash.noarch 1:5.0.0-1

Complete!
Then I confirmed the config file is okay:
<> sudo /usr/share/logstash/bin/logstash --config.test_and_exit --path.settings=/etc/logstash/ -f /etc/logstash/conf.d/logstash-syslog.conf
Sending Logstash logs to /var/log/logstash which is now configured via log4j2.properties.
Configuration OK
Now let’s start the service:
<> sudo systemctl daemon-reload
<> sudo systemctl start logstash.service
<> sudo journalctl -fu logstash.service
-- Logs begin at Wed 2016-10-26 07:23:03 MDT. --
Oct 29 15:27:28 puppet.kar.int logstash[32100]: "type" => "syslog",
Oct 29 15:27:28 puppet.kar.int logstash[32100]: "syslog_message" => "Popping table",
Oct 29 15:27:28 puppet.kar.int logstash[32100]: "syslog_pri" => "15",
Oct 29 15:27:28 puppet.kar.int logstash[32100]: "tags" => [
Oct 29 15:27:28 puppet.kar.int logstash[32100]: [0] "_geoip_lookup_failure"
Oct 29 15:27:28 puppet.kar.int logstash[32100]: ]
Oct 29 15:27:28 puppet.kar.int logstash[32100]: }
Oct 29 15:27:29 puppet.kar.int systemd[1]: Stopping logstash...
Oct 29 15:27:36 puppet.kar.int systemd[1]: Started logstash.
Oct 29 15:27:36 puppet.kar.int systemd[1]: Starting logstash...
Oct 29 15:27:50 puppet.kar.int logstash[551]: Sending Logstash logs to /var/log/logstash which is now configured via log4j2.properties.
Oct 29 15:27:54 puppet.kar.int logstash[551]: {
Oct 29 15:27:54 puppet.kar.int logstash[551]: "reason" => "match",
Oct 29 15:27:54 puppet.kar.int logstash[551]: "flags" => "DF",
Oct 29 15:27:54 puppet.kar.int logstash[551]: "rule" => "5",
Oct 29 15:27:54 puppet.kar.int logstash[551]: "type" => "pfsense",
I used to use the stdout output module, but with 5.0 that ended up logging to syslog and journalctl, so I changed that to be file instead of stdout:
<> tail -3 /etc/logstash/conf.d/logstash-syslog.conf
  file { path => "/var/log/logstash/logstash-syslog.log" codec => rubydebug }
#  stdout { codec => rubydebug }
}
Then one more restart:
<> sudo systemctl restart logstash
and I saw the logs under /var/log/logstash/logstash-syslog.log and not under /var/log/messages. I had to re-add the logrotate config back since the rpm install removed it. Also with the new version there is an API now available on logstash, so you could check out the version like this:
<> curl "127.0.0.1:9600/?pretty"
{
  "host" : "puppet.kar.int",
  "version" : "5.0.0",
  "http_address" : "127.0.0.1:9600",
  "build_date" : "2016-10-26T04:09:44Z",
  "build_sha" : "6ffe6451db6a0157cc6dd23458a0342c3118a9b0",
  "build_snapshot" : false
}%
Post Upgrade Changes
I ended up lowering the memory usage for the logstash and elasticsearch java instances:
<> grep -iE '^\-Xms|^\-Xmx' /etc/logstash/jvm.options /etc/elasticsearch/jvm.options
/etc/logstash/jvm.options:-Xms256m
/etc/logstash/jvm.options:-Xmx512m
/etc/elasticsearch/jvm.options:-Xms768m
/etc/elasticsearch/jvm.options:-Xmx768m
Also my logstash config kept failing to do geoip lookup on internal IPs. I had the setup that’s covered here which didn’t do geoip lookups on internal IPs. I had to move the src_ip if loop inside the first if statement that checked if it’s a SuricataIDPS type. After that the geoip started working appropriately. I feels like the filter option is now globally applied to all the inputs not just within the config file.