Alerting with Prometheus on Kubernetes
After doing the setup with metricbeat I decided to try also try out prometheus to monitor a kubernetes cluster. As I kept doing some research I ran into a couple of guides that shared a common deployment:
- Kubernetes Monitoring with Prometheus: AlertManager, Grafana, PushGateway (part 2).
- How To Set Up a Kubernetes Monitoring Stack with Prometheus, Grafana and Alertmanager on DigitalOcean
- Production grade Kubernetes Monitoring using Prometheus
- How to Setup Prometheus Monitoring On Kubernetes Cluster
I saw a pretty common architecture with Prometheus:
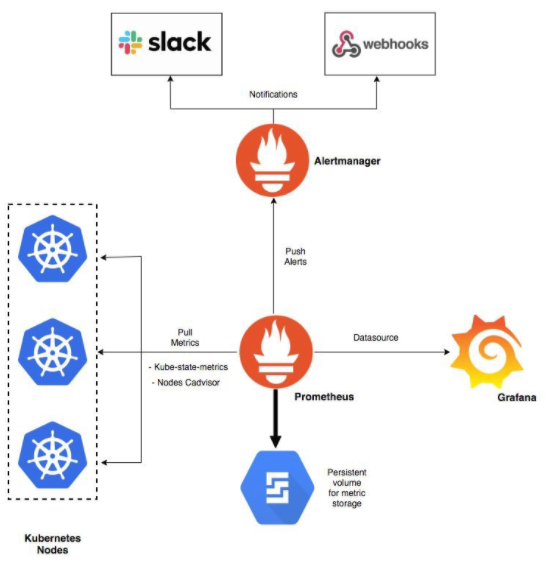
And here the components involved:
- Prometheus is a time series database and monitoring tool that works by polling metrics endpoints and scraping and processing the data exposed by these endpoints. It allows you to query this data using PromQL, a time series data query language.
- Alertmanager, usually deployed alongside Prometheus, forms the alerting layer of the stack, handling alerts generated by Prometheus and deduplicating, grouping, and routing them to integrations like email
- Grafana is a data visualization and analytics tool that allows you to build dashboards and graphs for your metrics data
- kube-state-metrics is an add-on agent that listens to the Kubernetes API server and generates metrics about the state of Kubernetes objects like Deployments and Pods. These metrics are served as plaintext on HTTP endpoints and consumed by Prometheus.
- node-exporter a Prometheus exporter that runs on cluster nodes and provides OS and hardware metrics like CPU and memory usage to Prometheus. These metrics are also served as plaintext on HTTP endpoints and consumed by Prometheus.
Getting Kubernetes Metrics into Prometheus
Before starting this endeavor I had already deployed prometheus and so I just needed to add the appropriate targets. The Kubernetes Monitoring with Prometheus -The ultimate guide (part 1) covers a lot of the setup. The first part is to pick which targets you want to pull data from. From that page:
- Apart from application metrics, we want Prometheus to collect metrics related to the Kubernetes services, nodes and orchestration status.
- Node exporter, for the classical host-related metrics: cpu, mem, network, etc.
- Kube-state-metrics for orchestration and cluster level metrics: deployments, pod metrics, resource reservation, etc.
- Kube-system metrics from internal components: kubelet, etcd, dns, scheduler, etc.
And from that page they have a very similar architecture diagram:
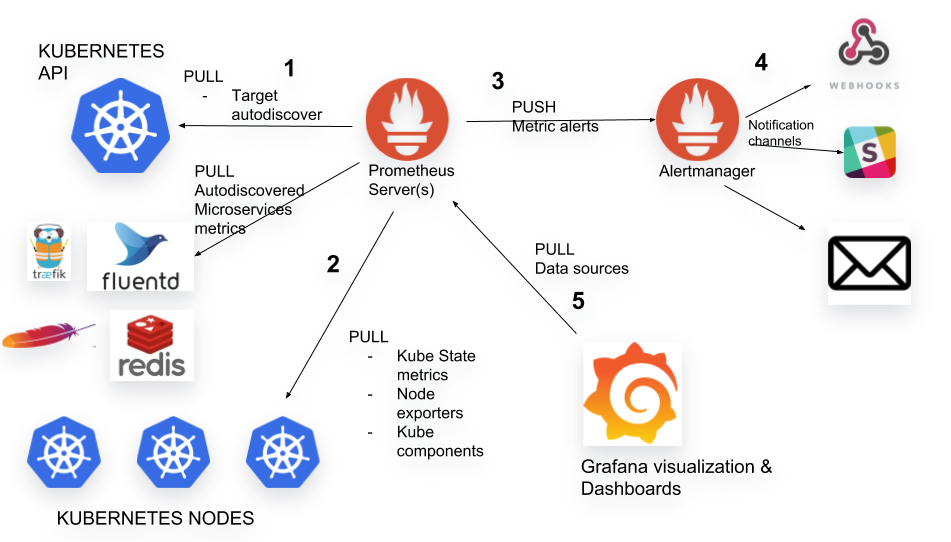
I decided to collect information from the following:
- node exporter (I will need to install that)
- cAdvisor (as from the previous post I will just add that as a scraping target)
- kube-state-metrics (I had already deployed this during the metribeat setup)
- k8s-api-server (similar to cAdvisor, I will just add that as a scraping target)
So let’s run through these.
Installing Prometheus Node Exporter on Kubernetes
I decided to use helm for the install:
> git clone https://github.com/helm/charts.git
> cd charts
> helm template -f /data/k8s/node-exporter/helm-values.yml stable/prometheus-node-exporter
I modified the output as I wanted and then applied the daemonset and service resources. After which I had the service deployed:
> k get ds node-exporter
NAME            DESIRED   CURRENT   READY   UP-TO-DATE   AVAILABLE   NODE SELECTOR   AGE
node-exporter   1         1         1       1            1           <none>          2m1s
> k get svc node-exporter
NAME            TYPE        CLUSTER-IP      EXTERNAL-IP   PORT(S)    AGE
node-exporter   ClusterIP   10.96.234.205   <none>        9100/TCP   10s
Querying the ClusterIP, I saw the metrics:
> curl http://$(k get svc node-exporter -o=jsonpath="{.spec.clusterIP}"):9100/metrics -s | grep node_cpu_core_throttles
# HELP node_cpu_core_throttles_total Number of times this cpu core has been throttled.
# TYPE node_cpu_core_throttles_total counter
node_cpu_core_throttles_total{core="0",package="0"} 0
node_cpu_core_throttles_total{core="1",package="0"} 59
node_cpu_core_throttles_total{core="2",package="0"} 69
node_cpu_core_throttles_total{core="3",package="0"} 0
Since this instance is running as a container in our kubernetes cluster we use the scraping configuration to auto discover it.
Creating Scraping Configs for Kubernetes Resources in Prometheus
There is a very nice example in the prometheus git repo and the configuration page goes over all the available options for prometheus. For example here is one to scrape any service that has the prometheus.io/scrape annotation added:
# Monitor Service Endpoints
# All the Service endpoints will be scrapped if the service
# metadata is annotated with prometheus.io/scrape and
# prometheus.io/port annotations.

- job_name: 'kubernetes-service-endpoints'
  kubernetes_sd_configs:
  - role: endpoints
  relabel_configs:
  - source_labels: [__meta_kubernetes_service_annotation_prometheus_io_scrape]
    action: keep
    regex: true
  - source_labels: [__meta_kubernetes_service_annotation_prometheus_io_scheme]
    action: replace
    target_label: __scheme__
    regex: (https?)
  - source_labels: [__meta_kubernetes_service_annotation_prometheus_io_path]
    action: replace
    target_label: __metrics_path__
    regex: (.+)
  - source_labels: [__address__, __meta_kubernetes_service_annotation_prometheus_io_port]
    action: replace
    target_label: __address__
    regex: ([^:]+)(?::\d+)?;(\d+)
    replacement: $1:$2
  - action: labelmap
    regex: __meta_kubernetes_service_label_(.+)
  - source_labels: [__meta_kubernetes_namespace]
    action: replace
    target_label: kubernetes_namespace
  - source_labels: [__meta_kubernetes_service_name]
    action: replace
    target_label: kubernetes_name
And here is one for cAdvisor:
# Scrape config for Kubelet cAdvisor.
- job_name: 'kubernetes-cadvisor'
  scheme: https
  tls_config:
    ca_file: /var/run/secrets/kubernetes.io/serviceaccount/ca.crt
  bearer_token_file: /var/run/secrets/kubernetes.io/serviceaccount/token
  kubernetes_sd_configs:
  - role: node
  relabel_configs:
  - action: labelmap
    regex: __meta_kubernetes_node_label_(.+)
  - target_label: __address__
    replacement: kubernetes.default.svc:443
  - source_labels: [__meta_kubernetes_node_name]
    regex: (.+)
    target_label: __metrics_path__
    replacement: /api/v1/nodes/${1}/proxy/metrics/cadvisor
After applying the new scraping_configs, I saw the newly discovered services:
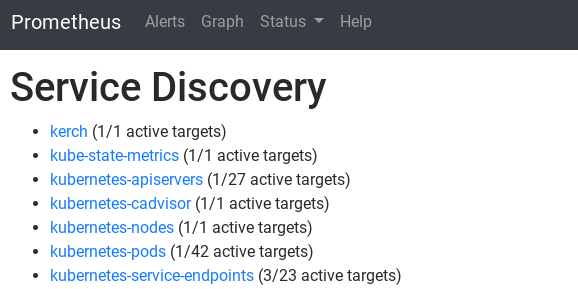
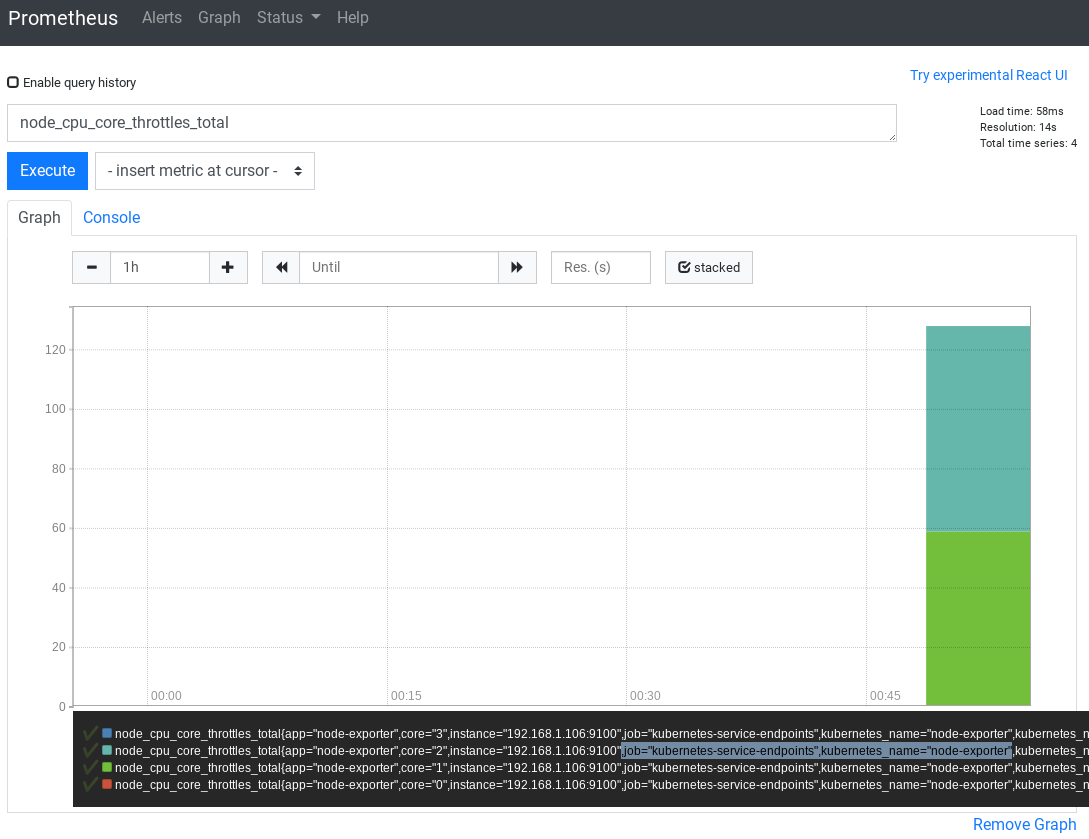
and I was also able to find the same metric and confirm that the kubernetes-service-endpoints job got those metrics:
I did enable the appropriate annotation for the service:
> k get svc node-exporter -o yaml | grep ' prom'
    prometheus.io/scrape: "true"
I was also able to create a quick graph of the information gathered by cAdvisor:

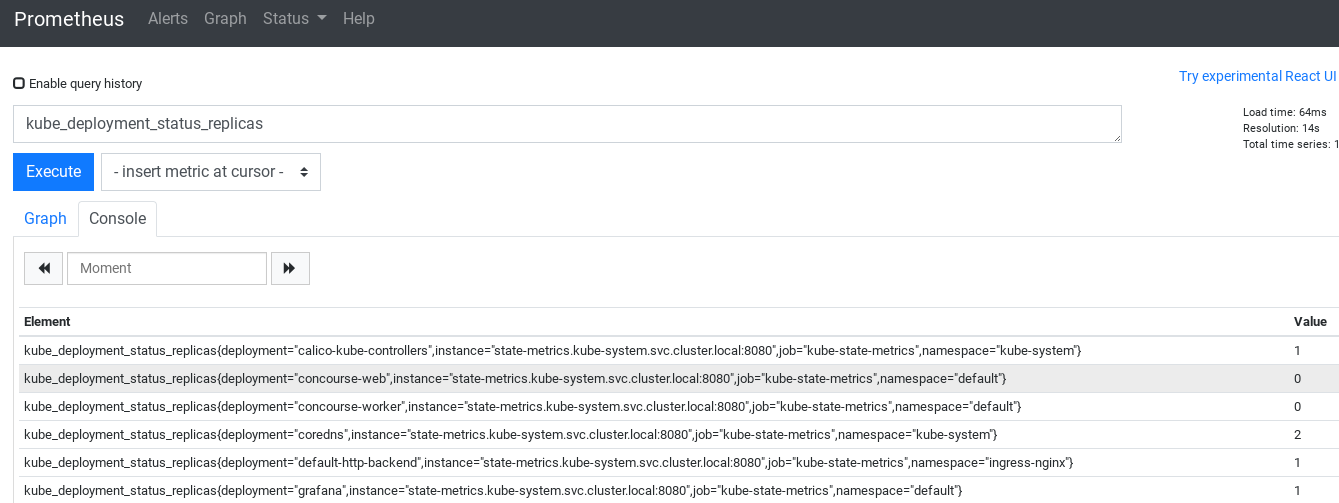
Adding kube-state-metrics to Prometheus
After installing kube-state-metrics and adding it as a target to Prometheus:
- job_name: 'kube-state-metrics'
        static_configs:
        - targets: ['state-metrics.kube-system.svc.cluster.local:8080']
I was seeing the metrics in Prometheus:
Adding Dashboards to Grafana
I already had grafana running, so I just added 3 dashboards:
- Node Exporter Full
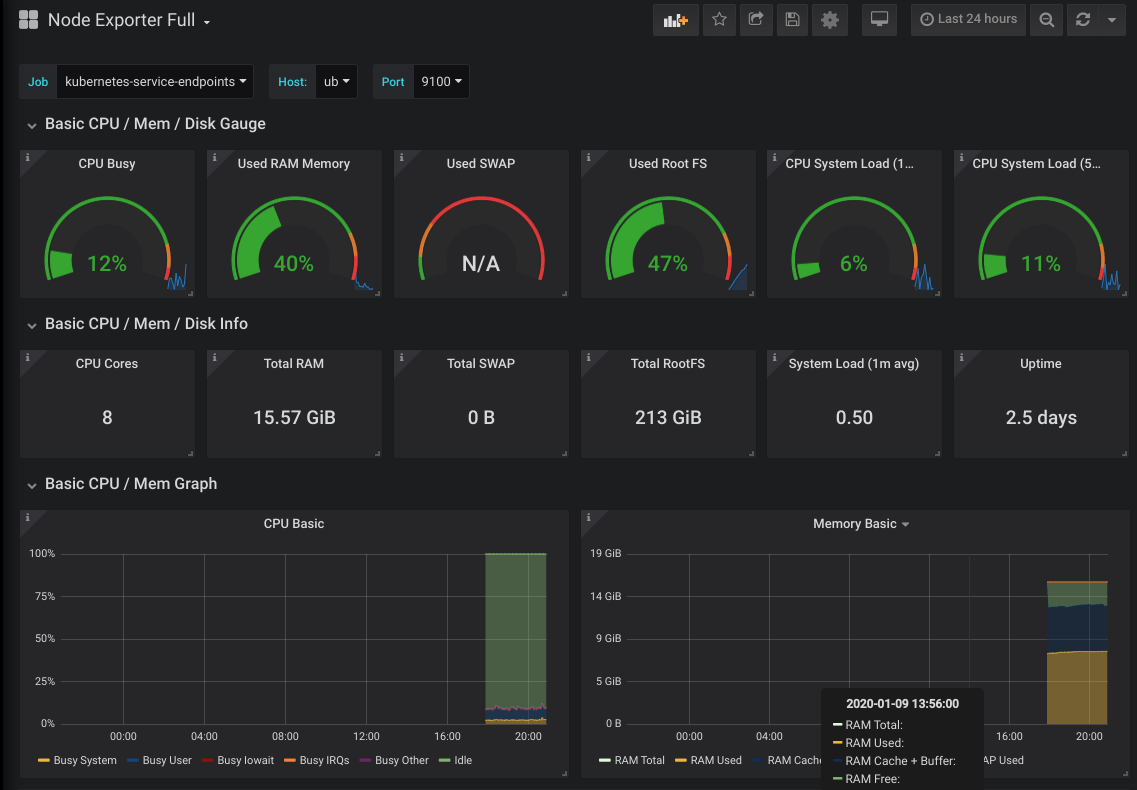
- Kubernetes cluster monitoring (via Prometheus)

- Kubernetes Deployment Statefulset Daemonset metrics

And they showed a lot of information about the kubernetes environment.
Install Alertmanager
The last component of the setup is to install alertmanager. I decided to use the prometheus helm chart to get a starting point:
> git clone https://github.com/helm/charts.git
> cd charts
> helm template -f /data/k8s/alertmanager/helm-values.yaml stable/prometheus
And I found a couple of nice sample configs for alertmanager (alerta/prometheus-config and alertmanager/doc/examples/simple.yml). After it’s deployed we should see the service and deployment created:
> k get deploy alertmanager
NAME           READY   UP-TO-DATE   AVAILABLE   AGE
alertmanager   1/1     1            1           173m
> k get svc alertmanager
NAME           TYPE        CLUSTER-IP     EXTERNAL-IP   PORT(S)    AGE
alertmanager   ClusterIP   10.96.45.195   <none>        9093/TCP   173m
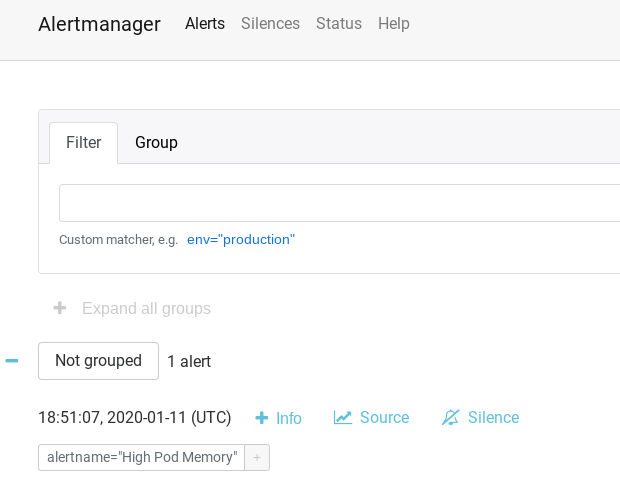
We can also visit the UI and check out how it looks:
I also ran into a couple of guides on how to setup alertmanager which helped in understanding how powerful the tool is:
Update Prometheus Configuration to include Alertmanager
Next we can update the prometheus configuration to point to alertmanager (at the minimum something like this):
  prometheus.rules: |-
    groups:
    - name: demo alert
      rules:
      - alert: High Pod Memory
        expr: sum(container_memory_usage_bytes) > 1
        for: 1m
        labels:
          severity: slack
        annotations:
          summary: High Memory Usage
  prometheus.yml: |-
    global:
      scrape_interval: 5s
      evaluation_interval: 5s
    rule_files:
      - /etc/prometheus/prometheus.rules
    alerting:
      alertmanagers:
      - scheme: http
        static_configs:
        - targets:
          - "alertmanager.monitoring.svc:9093"
There are a couple of nice examples that I ran into:
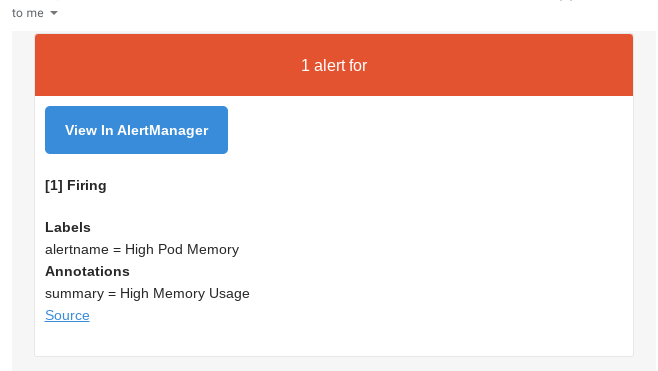
That default rule should send email (or a notification to what you had configured) right away:
Creating Alerting Rules
I found a pretty awesome site that has a bunch of examples: Awesome Prometheus alerts, it has example for node-exporter and cAdvisor, here are some sample alerts from that page:
- alert: OutOfMemory
  expr: node_memory_MemAvailable_bytes / node_memory_MemTotal_bytes * 100 < 10
  for: 5m
  labels:
    severity: warning
  annotations:
    summary: "Out of memory (instance {{ $labels.instance }})"
    description: "Node memory is filling up (< 10% left)\n  VALUE = {{ $value }}\n  LABELS: {{ $labels }}"
And here is another one:
- alert: ContainerKilled
  expr: time() - container_last_seen > 60
  for: 5m
  labels:
    severity: warning
  annotations:
    summary: "Container killed (instance {{ $labels.instance }})"
    description: "A container has disappeared\n  VALUE = {{ $value }}\n  LABELS: {{ $labels }}"
Here are some other resources:
I picked a few, added them to the config and saw them fire:

And I got to fixing them right away :)
Loading Multiple ConfigMaps into the same directory
Since the helm charts comes with an automatic config reloader, I wanted to take advantage of it. You can also confirm that the pod has two containers:
> k get pod -l app=alertmanager
NAME                            READY   STATUS    RESTARTS   AGE
alertmanager-6b8b455c78-tlmv6   2/2     Running   0          3h1m
However, I wanted to separate the configMaps into the base prometheus config and the prometheus rules. The usual way to handle that is with subpath, but there is a bug with subpath where the files are not updated if you update the configmap. But there is nice feature called projected volumes which gets around the issue. So now when I either create a new alerting rule or add a new target to prometheus, I just update either of the configmaps, and the config autoreloader sends a reload request to the prometheus container. Here is what I usually see in the reload container logs:
> k logs -f  -l app=prometheus-server -c watch
2020/01/11 21:34:05 DEBUG: Watching /etc/prometheus/..data
2020/01/11 21:34:05 DEBUG: "/etc/prometheus/..2020_01_11_21_32_35.868875277/prometheus.rules": REMOVE at 2020-01-11 21:34:05.487602504 +0000 UTC
2020/01/11 21:34:05 DEBUG: "/etc/prometheus/..2020_01_11_21_32_35.868875277/prometheus.yml": REMOVE at 2020-01-11 21:34:05.487602504 +0000 UTC
2020/01/11 21:34:05 DEBUG: "/etc/prometheus/..2020_01_11_21_32_35.868875277": REMOVE at 2020-01-11 21:34:05.487602504 +0000 UTC
2020/01/11 21:34:05 DEBUG: "/etc/prometheus/..2020_01_11_21_32_35.868875277": REMOVE at 2020-01-11 21:34:05.487602504 +0000 UTC
curl -X POST --fail -o - -sS http://localhost:9090/-/reload
2020-01-11 21:34:05.712184729 +0000 UTC m=+244.570911916
And on the prometheus container I see the reload:
> k logs -f -l app=prometheus-server -c prometheus
level=info ts=2020-01-11T21:32:35.710Z caller=main.go:762 msg="Completed loading of configuration file" filename=/etc/prometheus/prometheus.yml
level=info ts=2020-01-11T21:34:05.700Z caller=main.go:734 msg="Loading configuration file" filename=/etc/prometheus/prometheus.yml
level=info ts=2020-01-11T21:34:05.703Z caller=kubernetes.go:190 component="discovery manager scrape" discovery=k8s msg="Using pod service account via in-cluster config"
level=info ts=2020-01-11T21:34:05.704Z caller=kubernetes.go:190 component="discovery manager scrape" discovery=k8s msg="Using pod service account via in-cluster config"
level=info ts=2020-01-11T21:34:05.705Z caller=kubernetes.go:190 component="discovery manager scrape" discovery=k8s msg="Using pod service account via in-cluster config"
level=info ts=2020-01-11T21:34:05.708Z caller=main.go:762 msg="Completed loading of configuration file" filename=/etc/prometheus/prometheus.yml
Pretty cool configuration over all.